
The Merck Millipore division, a leading supplier of the life science industry, had a solid start in 2012. This division represented 26% of the Group’s sales.
Its first-quarter 2012 sales rose 7.3% to € 653 million compared to € 608 million in the year-ago period. The division generated organic sales growth of 2.7% with changes in foreign exchange rates adding 2.0% and acquisitions a further 2.5% in growth.
| XLS |
|
Merck Millipore | Key figures – Q1 | |||
|
|
|
|
|
|
|
|
|
|
|
€ million |
Q1 – 2012 |
Q1 – 2011 |
Change |
|
Total revenues |
655.4 |
611.3 |
7.2% |
|
Sales |
652.6 |
608.4 |
7.3% |
|
Operating result (EBIT) |
78.3 |
74.2 |
5.4% |
|
Margin (% of sales) |
12.0% |
12.2% |
|
|
EBITDA |
154.0 |
146.2 |
5.3% |
|
Margin (% of sales) |
23.6% |
24.0% |
|
|
EBITDA pre one-time items |
161.4 |
158.4 |
1.9% |
|
Margin (% of sales) |
24.7% |
26.0% |
|
Merck Millipore’s top-line performance was driven by solid results from its Lab Solutions and Process Solutions business units. The Lab Solutions business unit reported 3.3% organic sales growth, boosted by an increasing number of tests for environmental, drug and food quality and higher demand for consumables and instruments sold into laboratories. The Process Solutions business unit reported 2.7% organic sales growth and is benefiting from higher levels of biotech drug production. The organic sales growth of Process Solutions was lower due to the loss of a contract to re-sell insulin into the biopharmaceutical manufacturing market. Finally, the Bioscience business unit generated 1.3% organic sales growth as research markets remained soft due to lower funding of academic research and weaker demand from pharmaceutical customers.
Merck Millipore’s gross profit increased 9.2% to € 390 million in the first quarter of 2012 from € 357 million in the year-ago quarter. The gross margin was 59.7% in the first quarter of 2012 compared to 58.6% in the year-ago quarter. This improvement resulted mainly from higher sales. Selling, general and administration (SG&A) costs rose by 10% compared to the first quarter of last year, primarily driven by unfavorable currency effects, added costs from recently acquired companies, and investments in the division’s sales force, predominantly in the United States.
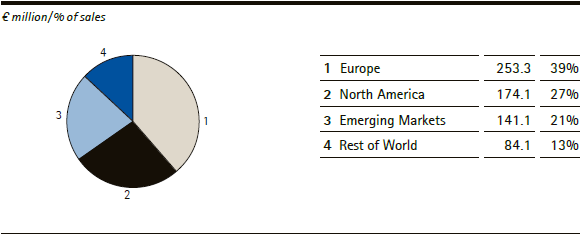
Merck Millipore | Sales by region – Q1
Research and development spending increased 16%, reflecting acquisitions and investments made in the Process Solutions business unit. The division is investing heavily into single-use products and developing integrated process-unit solutions for customers.
| XLS |
|
Merck Millipore | Growth components by region – Q1 | |||||
|
|
|
|
|
|
|
|
|
|
|
|
|
|
|
€ million/change in % |
Sales |
Organic growth |
Exchange rate |
Acquisitions/ |
Reported |
|
Europe |
253.3 |
5.2% |
0.4% |
4.6% |
10.3% |
|
North America |
174.1 |
–5.6% |
3.5% |
1.8% |
–0.3% |
|
Emerging Markets |
141.1 |
6.7% |
0.4% |
0.3% |
7.4% |
|
Rest of World |
84.1 |
7.2% |
6.6% |
1.9% |
15.7% |
Merck Millipore’s EBITDA pre for the first quarter of 2012 was € 161 million, or 24.7% of sales, compared to € 158 million, or 26.0% of sales, in the year-ago quarter. The modest growth of EBITDA pre reflects the investments the division is making for future growth.
From a geographic perspective, all regions contributed to growth with the exception of North America, mainly due to the loss of the insulin contract mentioned above.