
In the second quarter of 2012, the Merck Millipore division continued to benefit from solid demand across all its business units, increasing its sales by 11.4% to € 649 million (Q2 2011: € 583 million). Organically, sales grew 3.2% driven by both higher volumes and net pricing gains, supported by a 6.0% positive benefit in changes from foreign exchange rates and a 2.2% boost from acquisitions. Growth was primarily spurred by the Process Solutions and Lab Solutions business units.
In the Bioscience business unit, which contributed approximately 18% to divisional sales, organic growth mainly came from solutions for protein detection and separation in Asian countries. Meanwhile, the Lab Solutions business unit, representing approximately 42% of the division’s sales, saw positive demand for its biomonitoring products as well as for lab water consumables and services. Finally, the Process Solutions business unit, which represented approximately 40% of sales, benefited from higher volumes of biologically manufactured drugs. The divison is also seeing strong demand for single-use manufacturing technologies, biosafety solutions and process systems hardware, which more than offset the impact of € 7 million in lost sales from the non-renewal of an insulin contract. Royalty income increased more than eight fold to € 6 million (Q2 2011: € 1 million), driven by Process Solutions.
| XLS |
|
Merck Millipore | Key figures | ||||||
|
|
|
|
|
|
|
|
|
|
|
|
|
|
|
|
|
€ million |
Q2 2012 |
Q2 2011 |
Change |
Jan.–June |
Jan.–June |
Change |
|
Total revenues |
655.3 |
583.7 |
12.3% |
1,310.7 |
1,195.0 |
9.7% |
|
Sales |
649.5 |
583.1 |
11.4% |
1,302.1 |
1,191.5 |
9.3% |
|
Operating result (EBIT) |
65.3 |
48.4 |
34.9% |
143.6 |
122.7 |
17.1% |
|
Margin (% of sales) |
10.1% |
8.3% |
|
11.0% |
10.3% |
|
|
EBITDA |
141.2 |
119.1 |
18.5% |
295.1 |
265.3 |
11.2% |
|
Margin (% of sales) |
21.7% |
20.4% |
|
22.7% |
22.3% |
|
|
EBITDA pre one-time items |
147.9 |
128.6 |
15.0% |
309.4 |
287.0 |
7.8% |
|
Margin (% of sales) |
22.8% |
22.1% |
|
23.8% |
24.1% |
|
During the second quarter of 2012, the division’s cost of sales increased 6.6% to € 270 million (Q2 2011: € 253 million), yielding a gross profit of € 385 million (Q2 2011: € 330 million) or 59.3% of sales (Q2 2011: 56.6%). This gross margin expansion primarily reflects operational leverage from higher volumes and efficiency gains in manufacturing as well as stronger pricing.
Marketing and selling expenses were up 15.0% to € 169 million (Q2 2011: € 147 million). Since the majority of the division’s costs are concentrated in the United States, Merck Millipore was negatively impacted by the stronger US$, which increased SG&A costs by € 7 million during the quarter. In addition, investments into the sales organization as reflected in top-line performance contributed to the division’s cost increase, as did the effect from acquired businesses.
Merck Millipore’s R&D costs grew 31.6% to € 42 million (Q2 2011: € 32 million), as the division continued to invest heavily in future growth. A meaningful portion of the increase came from Process Solutions, reflecting the division’s expectation that increasing volumes for biopharmaceuticals will remain an attractive growth driver in the future. In sum, the division’s EBIT improved by 34.9% to € 65 million (Q2 2011: € 48 million) while EBITDA increased by 18.5% to € 141 million (Q2 2011: € 119 million). Adjusted for one-time charges, which were minor in both this year’s as well as last year’s second quarter, EBITDA pre one-time items grew 15.0% to € 148 million, or 22.8% of sales (Q2 2011: € 129 million, 22.1% of sales).
Merck Millipore | Sales by region – Q2 2012
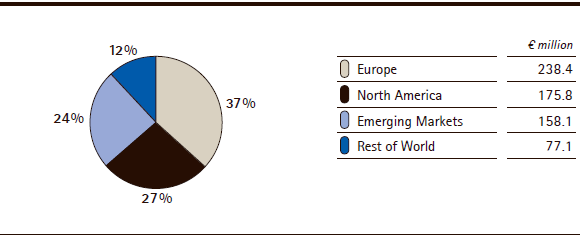
In the second quarter of 2012, Europe continued to represent the largest regional market for Merck Millipore generating 37% of sales. While overall organic sales growth from biopharmaceutical customers in Europe was flat, softer instruments sales were offset by growing consumables sales. In the United States, weaker sales to academic customers, which primarily affect the Bioscience and the Lab Solutions business units, were little changed. Sales growth in the Emerging Markets and Rest of World regions was evident in all three of the division’s business units.
| XLS |
|
Merck Millipore | Growth components by region – Q2 2012 | |||||
|
|
|
|
|
|
|
|
|
|
|
|
|
|
|
€ million/change in % |
Sales |
Organic |
Exchange rate effects |
Acquisitions/ |
Reported |
|
Europe |
238.4 |
0.4% |
0.8% |
4.0% |
5.1% |
|
North America |
175.8 |
–1.6% |
12.0% |
1.4% |
11.8% |
|
Emerging Markets |
158.1 |
9.8% |
4.4% |
0.3% |
14.6% |
|
Rest of World |
77.1 |
10.7% |
13.5% |
2.0% |
26.2% |
Half-Year 2012 Performance
Merck Millipore’s first half total revenues grew 9.7 to € 1,311 million (H1 2011: € 1,195 million), including € 9 million from royalties (H1 2011: € 4 million). Sales were up 9.3% to € 1,302 million (H1 2011: € 1,191 million). While robust demand in all three business units generated organic sales growth of 2.9%, favorable changes in foreign exchange rates added 4.0%. In addition, last year’s acquisitions of Amnis and heipha/Hycon which strengthened Merck Millipore’s product offering in the Life Science and BioMonitoring business fields contributed 2.4% to the reported top line growth.
The division’s first-half EBITDA pre one-time items increased 7.8% to € 309 million (H1 2011: € 287 million), equivalent to a margin of 23.8%, nearly unchanged from the year-ago period (H1 2011: 24.1%).