
In the third quarter of 2012, the Performance Materials division posted exceptionally strong sales of € 446 million (Q3 2011: € 340 million), up 31.1%, driven by record sales for liquid crystal materials. In addition, Performance Materials’ sales growth benefited the most among all Merck’s divisions from the stronger US dollar since a significant portion of its sales are recognized in this currency. In summary, Perfomance Materials reported organic sales growth of 19.7% while changes in foreign exchange rates contributed 11.4%.
Volumes in the Liquid Crystals business – which account for approximately three-fourths to the division’s sales – benefited from higher demand from panel manufacturers in advance of the holiday shopping season. As a result, the volume of liquid crystals based on polymer stabilized vertical alignment (PS-VA) technology, primarily used in mid- and large-sized televisions, doubled compared to the third quarter in 2011. In addition, strong consumer demand for mobile touch-screen displays (smartphones, tablet PCs) drove liquid crystals volumes. Mobile devices primarily use liquid crystals based on in-plane switching (IPS) technology because it offers the widest viewing angle. Finally, the division is benefiting from the emergence of a Chinese customer base, which is primarily serving local consumer demand for LCDs.
However, given the typical seasonal cyclicality in LCD manufacturing, the company expects demand for liquid crystals in the fourth quarter to soften sequentially resulting in the division’s EBITDA pre being around last year’s fourth quarter.
In Pigments and Cosmetics, sales increased across all business fields compared to a lower base in the third quarter of 2011. Sales of the business unit’s products were lower in Q3 2011 due, in part, to the effects of the earthquake in Japan last year.
| XLS |
|
Performance Materials | Key figures | ||||||
|
|
|
|
|
|
|
|
|
|
|
|
|
|
|
|
|
€ million |
Q3 2012 |
Q3 2011 |
Change |
Jan.–Sept. 2012 |
Jan.–Sept. 2011 |
Change |
|
Total revenues |
446.7 |
341.7 |
30.7% |
1,259.5 |
1,123.8 |
12.1% |
|
Sales |
446.0 |
340.1 |
31.1% |
1,258.6 |
1,121.5 |
12.2% |
|
Operating result (EBIT) |
161.2 |
115.0 |
40.1% |
467.9 |
549.8 |
–14.9% |
|
Margin (% of sales) |
36.1% |
33.8% |
|
37.2% |
49.0% |
|
|
EBITDA |
191.9 |
140.3 |
36.8% |
556.0 |
636.3 |
–12.6% |
|
Margin (% of sales) |
43.0% |
41.2% |
|
44.2% |
56.7% |
|
|
EBITDA pre one-time items |
194.8 |
140.4 |
38.8% |
544.8 |
517.7 |
5.2% |
|
Margin (% of sales) |
43.7% |
41.3% |
|
43.3% |
46.2% |
|
During the third quarter, the division’s production costs amounted to € 189 million (Q3 2011: € 146 million), up 30.0%. Increased operating leverage from higher sales was offset by softer pricing for liquid crystals and the company’s decision to optimize inventory levels. This resulted in a gross margin of 57.7% that was nearly unchanged year-on-year (Q3 2011: 57.6%)
Selling, general and administration (SG&A) costs increased by 30.6% to € 61 million (Q3 2011: € 47 million) due to higher marketing and selling expenses and € 7 million of one-time charges stemming from the “Fit for 2018” efficiency program that were partly balanced by a release of a provision related to a discontinued business. R&D spending increased slightly to € 35 million (Q3 2011: € 34 million) with the majority of that amount being invested in the Liquid Crystals business.
Reported EBIT was up 40.1% amounting to € 161 million (Q3 2011: € 115 million), while EBITDA increased by 36.8% to € 192 million (Q3 2011: € 140 million). Adjusting for € 3 million in one-time items, EBITDA pre improved by 38.8% to € 195 million, or 43.7% of sales (Q3 2011: € 140 million, or 41.3% of sales).
Performance Materials | Sales by region – Q3 2012
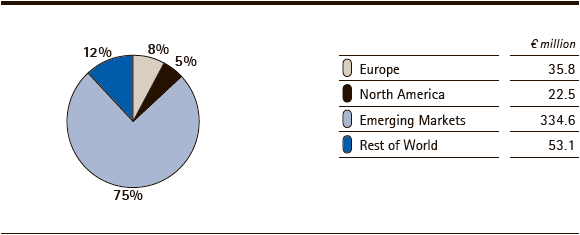
From a regional perspective, Emerging Markets generated 75% of sales for Performance Materials in the third quarter of 2012, reflecting the concentration of liquid crystals customers in Asia. Divisional sales in this region showed a strong 32.9% organic increase. The decline in European sales is mostly related to the Pigments and Cosmetics business unit due to a slowing automotive production in this region.
| XLS |
|
Performance Materials | Growth components by region – Q3 2012 | |||||
|
|
|
|
|
|
|
|
|
|
|
|
|
|
|
€ million/change in % |
Sales |
Organic |
Exchange rate effects |
Acquisitions/ |
Reported |
|
Europe |
35.8 |
–3.1% |
0.6% |
– |
–2.6% |
|
North America |
22.5 |
19.5% |
13.8% |
– |
33.4% |
|
Emerging Markets |
334.6 |
32.9% |
13.7% |
– |
46.7% |
|
Rest of World |
53.1 |
–17.5% |
8.5% |
– |
–8.9% |
First Nine Months 2012 Performance
Looking at the divisional performance for the first nine months of 2012, sales grew 12.2% to € 1,259 million (9M 2011: € 1,122 million) driven by an organic sales increase of 4.4% and a 7.9% benefit from foreign exchange rates. Demand for liquid crystals accelerated in the second and third quarters due to increasing demand from display makers. Sales in Pigments and Cosmetics remained flat during the first nine months of 2012 due to weak demand for coatings in Europe, which was offset by growth from active ingredients for cosmetic applications and a recovery of the US coatings business.
EBITDA pre one-time items increased 5.2% to € 545 million (9M 2011: € 518 million), reflecting the strong year-to-date performance of the Liquid Crystals business unit due to record volumes driven by healthy consumer demand for TVs, smartphones and tablet PC’s. However, the division’s margin as a percentage of sales declined to 43.3% (9M 2011: 46.2%) due to lower pricing and the weaker operational performance of the Pigments and Cosmetics business unit.