In 2013, Merck performed well in a challenging market environment. Despite adverse exchange rate movements, strong earnings improvements were achieved, thanks mainly to the accelerated implementation of the efficiency measures within the scope of the “Fit for 2018” transformation and growth program. In 2013, total revenues of the Merck Group declined slightly by –0.7% to € 11,095 million (2012: € 11,173 million). Organic growth increased total revenues by 3.8%. Negative foreign exchange effects lowered total revenues by –4.6%. Apart from the negative exchange rate movements of Latin American currencies and the U.S. dollar, this decline was mainly due to the exchange rate development of the Japanese yen. Acquisitions contributed 0.1% to the increase. Royalty, license and commission income, which is disclosed as part of total revenues, decreased by –8.6% to € 395 million (2012: € 432 million). This was mainly the result of the expiration of two license agreements in the Merck Serono division.
Sales (total revenues less royalty, license and commission income) saw solid organic growth of 4.2% in 2013 but the increase was outweighed by foreign exchange effects of –4.7%. Acquisitions increased sales by 0.1%. Overall, sales decreased slightly by € 41 million to € 10,700 million in 2013 (2012: € 10,741 million).
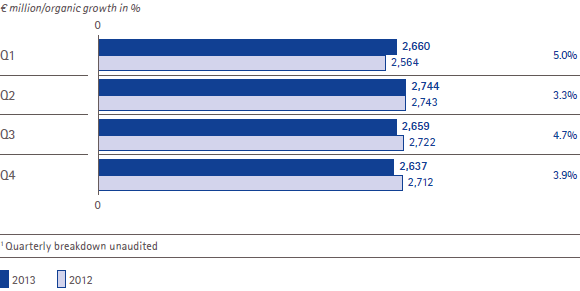
The development of sales in the individual quarters in comparison with 2012 as well as the respective organic growth rates are presented in the following table:
Merck Group | Sales and organic growth by quarter1
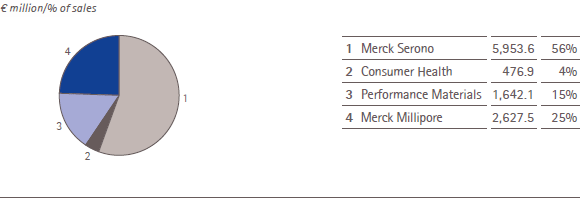
As regards the distribution of sales across the four operating divisions of the Merck Group, no significant changes occurred in 2013 compared with 2012. Merck Serono once again generated 56% of Group sales, remaining the largest division in terms of sales. Merck Millipore and Performance Materials followed, contributing 25% (2012: 24%) and 15% (2012: 16%) to Group sales, respectively. As in 2012, the Consumer Health division accounted for 4% of Group sales.
Merck Group | Sales by division – 2013
| XLS |
|
Merck Group | Sales components by division – 2013 |
|
||||
|
|
|
|
|
|
|
|
|
|
|
|
|
|
|
€ million/change in % |
Sales |
Organic growth |
Exchange rate effects |
Acquisitions/ |
Total change |
|
Merck Serono |
5,953.6 |
3.9 |
–4.6 |
– |
–0.7 |
|
Consumer Health |
476.9 |
5.6 |
–4.7 |
– |
0.9 |
|
Performance Materials |
1,642.1 |
3.0 |
–4.9 |
– |
–1.9 |
|
Merck Millipore |
2,627.5 |
5.5 |
–4.8 |
0.5 |
1.1 |
|
Merck Group |
10,700.1 |
4.2 |
–4.7 |
0.1 |
–0.4 |
All four divisions of the Merck Group posted organic sales increases with growth rates between 3.0% and 5.6% as well as negative exchange rate effects of around –5% in each division. Achieving organic sales growth of 3.9%, which corresponded to an absolute increase of € 235 million, Merck Serono made the strongest contribution to organic sales growth, followed by Merck Millipore with organic sales growth of € 142 million and a growth rate of 5.5%, as well as Performance Materials with € 51 million, or 3.0%. With an organic sales growth rate of 5.6%, the Consumer Health division reported the highest percentage increase, corresponding to an absolute sales increase of € 26 million.
Merck Group | Sales by region – 2013
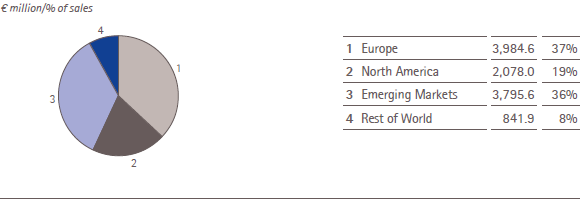
From a regional perspective, the dynamic business performance in the Emerging Markets region, which encompasses Latin America and Asia with the exception of Japan, contributed first and foremost to the organic growth of the Merck Group. At 9.3%, which corresponded to an absolute organic sales increase of € 347 million, the region delivered very strong organic growth, which was primarily driven by the Merck Serono division. Including currency headwinds of –7.1%, Group sales in the Emerging Markets region totaled € 3,796 million (2012: € 3,712 million). In 2013, the region thus increased its contribution to Group sales by two percentage points to 36%.
In Europe, organic sales growth of 1.4% was partially cancelled out by negative foreign exchange effects of –0.7%. Acquisitions contributed 0.3% to the increase in sales. Overall, sales in Europe increased slightly by 1.1% to € 3,985 million € (2012: € 3,943 million). Europe’s percentage contribution to Group sales thus remained unchanged at 37%.
The North America region posted sales amounting to € 2,078 million. (2012: € 2,128 million), which represents a year-on-year decrease of –2.4%. With a slight organic increase in sales of 0.6% coupled with negative exchange rate effects of –3.0%, North America’s contribution to Group sales was 19% (2012: 20%). Higher demand from customers of the Process Solutions and Lab Solutions business units of the Merck Millipore division made up for the slight organic sales decline incurred by Merck Serono in the region.
The Rest of World region, i.e. Japan, Africa and Australia/Oceania, generated € 842 million (2012: € 958 million) or 8% of Group sales (2012: 9%). The decline in sales was largely the outcome of a substantial foreign exchange impact of –16.0% mainly attributable to the Japanese yen. Organic growth of 3.9% in this region was primarily generated by the Merck Serono division.
| XLS |
|
Merck Group | Sales components by region – 2013 |
|
||||
|
|
|
|
|
|
|
|
|
|
|
|
|
|
|
€ million/change in % |
Sales |
Organic growth |
Exchange rate effects |
Acquisitions/ |
Total change |
|
Europe |
3,984.6 |
1.4 |
–0.7 |
0.3 |
1.1 |
|
North America |
2,078.0 |
0.6 |
–3.0 |
– |
–2.4 |
|
Emerging Markets |
3,795.6 |
9.3 |
–7.1 |
– |
2.2 |
|
Rest of World |
841.9 |
3.9 |
–16.0 |
– |
–12.1 |
|
Merck Group |
10,700.1 |
4.2 |
–4.7 |
0.1 |
–0.4 |