
Merck Millipore | Sales by region – 2013
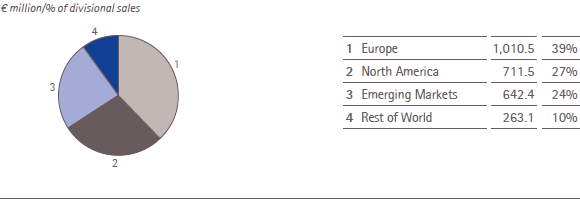
In 2013, the Merck Millipore division achieved positive organic growth rates in all regions. However, negative foreign exchange effects were registered in all regions as well.
As the division’s largest geographic market accounting for 39% of divisional sales (2012: 37%), Europe generated sales of € 1,010 million (2012: € 966 million), representing organic sales growth of 4.2%. The rise in sales was driven by all three business units: Process Solutions, Lab Solutions and Bioscience.
In North America, sales grew organically by 4.1%, largely offset by negative foreign exchange effects. Reported growth was 1.2%, which represents an increase in sales to € 711 million (2012: € 703 million). The organic increase in sales in this region mainly came from products from the Process Solutions and Lab Solutions business units, offsetting weaker demand for laboratory materials from the Bioscience business unit.
The Emerging Markets region registered organic sales growth of 10.5% and a negative foreign exchange impact of –6.6%. Including acquisition effects of 0.1%, sales rose to € 642 million (2012: € 617 million). The strong organic sales development was fueled by good demand for products from all the division’s business units. The share of divisional sales generated by the Emerging Markets region remained at the previous year’s level of 24%.
As a result of significant currency headwinds of –18.2%, especially relative to the Japanese yen, sales in the Rest of World region declined to € 263 million (2012: € 312 million). With slight organic growth of 2.4%, this region’s share of divisional sales declined to 10% (2012: 12%).
| XLS |
|
Merck Millipore | Sales components by region – 2013 |
|||||
|
|
|
|
|
|
|
|
|
|
|
|
|
|
|
€ million/change in % |
Sales |
Organic growth |
Exchange rate effects |
Acquisitions/ |
Total change |
|
Europe |
1,010.5 |
4.2 |
–0.7 |
1.2 |
4.6 |
|
North America |
711.5 |
4.1 |
–2.9 |
– |
1.2 |
|
Emerging Markets |
642.4 |
10.5 |
–6.6 |
0.1 |
4.1 |
|
Rest of World |
263.1 |
2.4 |
–18.2 |
– |
–15.8 |
|
Merck Millipore |
2,627.5 |
5.5 |
–4.8 |
0.5 |
1.1 |