
The Consumer Health division reported sales of € 116 million, an increase of 7.9% (Q1 2012: € 108 million). This reflected organic growth of 9.3% and a 1.4% decrease from changes in foreign exchange rates. The healthy organic increase was apparent across all regions, with sales in Europe benefiting particularly from good development of cough & cold treatments as a result of the unusually long winter period. In addition, growth was further stimulated by increased focus on strategic brands, like Bion® and Femibion®. The efficiency improvements Consumer Health initiated last year are well on track and are beginning to generate visible improvements to the division’s profitability. While sales momentum appears to be developing as a result of increased focus on top brands and countries, the division will continue to focus on margin expansion which may cause business volatility to remain in the near future.
| XLS |
|
Consumer Health | Key figures – Q1 |
|
|
|
|
|
|
|
|
|
|
|
|
|
|
€ million |
Q1 – 2013 |
Q1 – 2012 |
Change |
|
Total revenues |
116.3 |
108.0 |
7.7% |
|
Sales |
116.1 |
107.6 |
7.9% |
|
Operating result (EBIT) |
11.8 |
5.7 |
106.9% |
|
Margin (% of sales) |
10.1% |
5.3% |
|
|
EBITDA |
14.4 |
8.7 |
66.6% |
|
Margin (% of sales) |
12.4% |
8.0% |
|
|
EBITDA pre one-time items |
14.3 |
9.4 |
52.6% |
|
Margin (% of sales) |
12.3% |
8.7% |
|
With an increase of 4.1% to € 38 million (Q1 2012: € 37 million), production costs grew slower than sales due to a favorable product mix. As a result, gross profit grew 9.5% to € 78 million (Q1 2012: € 71 million), yielding a gross margin of 67.2% (Q1 2012: 66.2%). Consumer Health continued to effectively manage its operational spending. The division’s marketing and selling expenses fell by 1.9% due to an optimization of sales promotion spending and lower field force costs while overall SG&A costs increased 3.4% to € 62 million (Q1 2012: € 60 million). This increase reflects a total of € 4 million of higher costs compared to last year’s first quarter relating to an increase of provisions for litigation. R&D expenses fell 16.4% to € 4 million (Q1 2012: € 5 million) due to an increased focus of R&D investments and structural cost savings.
With gross profit outgrowing operational spending, EBIT more than doubled to € 12 million (Q1 2012: € 6 million). Similarly, EBITDA and EBITDA pre one-time items grew to € 14 million (Q1 2012: € 9 million), an increase of 66.6% and 52.6%, respectively. As a result, the EBITDA margin pre one-time items improved to 12.3% (Q1 2012: 8.7%).
Consumer Health | Sales by region – Q1 2013
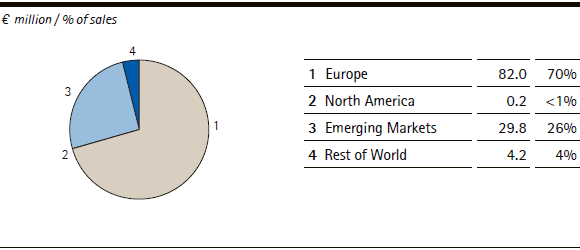
Sales development by region
From a geographic perspective, all regions except for North America contributed to organic sales growth. Europe, which accounted for the largest share of divisional sales (70%), saw an organic increase of 9.2% to € 82 million (Q1 2012: € 75 million), led by strong performance in France, Germany and Belgium. Sales in the Emerging Markets, representing 26% of divisional sales, grew similarly by 8.8% organically to € 30 million (Q1 2012: € 28 million), fueled by developments in Indonesia, Mexico, Brazil, Russia and India. With an organic sales increase of 24.7% to € 4 million, the Rest of World region saw the strongest regional growth rate, lifting its contribution to divisional sales to 4% (Q1 2012: 3%).
| XLS |
|
Consumer Health | Growth components by region – Q1 2013 | |||||
|
|
|
|
|
|
|
|
|
|
|
|
|
|
|
€ million/change in % |
Sales |
Organic growth |
Exchange rate effects |
Acquisitions/ |
Reported |
|
Europe |
82.0 |
9.2% |
–0.1% |
– |
9.1% |
|
North America |
0.2 |
–54.8% |
0.4% |
– |
–54.4% |
|
Emerging Markets |
29.8 |
8.8% |
–4.1% |
– |
4.7% |
|
Rest of World |
4.2 |
24.7% |
–8.9% |
– |
15.8% |