

The Performance Materials division continued its dynamic development of the preceding quarters. Reported sales increased by 9.0% to € 421 million (Q1 2012: € 386 million). While sales grew organically by 9.9%, changes in foreign exchange rates, especially relative to the Japanese yen, lowered sales by 0.9 percentage points, an impact not seen for several quarters.
Higher sales volumes of liquid crystal materials recorded in the Liquid Crystals business unit were the main driver of the strong organic growth rate, more than offsetting price declines due to competitive pressure and volume rebates. In particular, demand for liquid crystals based on polymer-stabilized vertical alignment technology (PS-VA), primarily used in medium- and large-sized television displays, was very strong. This development and higher sales volumes of liquid crystals based on in-plane switching (IPS) technology, which is used in televisions and especially in touchscreen devices such as tablet computers and smartphones, clearly made up for the volume declines in liquid crystals based on TN-TFT technology typically used in monitors and notebook displays. The high demand for liquid crystal materials offered by Performance Materials again underscores the technological superiority that Merck has achieved in a business dominated by high quality and innovation requirements. At the same time, the division has for several quarters been seeing signs of an inventory buildup in the display industry supply chain, which, according to current estimates, could possibly be worked down in the second half of the year. Merck therefore assumes a softer sales dynamic in the second half of the year compared to the previous year.
Pigments & Cosmetics, the division’s second business unit, also recorded organic growth in the first three months of 2013, which is typically its strongest quarter in terms of sales. This performance was driven both by higher demand for Xirallic® pigments, which are used mainly in automotive coatings, and functional materials for security printing applications.
| XLS |
|
Performance Materials | Key figures – Q1 |
|
|
|
|
|
|
|
|
|
|
|
|
|
|
€ million |
Q1 – 2013 |
Q1 – 2012 |
Change |
|
Total revenues |
422.1 |
386.2 |
9.3% |
|
Sales |
421.3 |
386.4 |
9.0% |
|
Operating result (EBIT) |
172.5 |
132.4 |
30.3% |
|
Margin (% of sales) |
41.0% |
34.3% |
|
|
EBITDA |
203.3 |
162.8 |
24.9% |
|
Margin (% of sales) |
48.3% |
42.1% |
|
|
EBITDA pre one-time items |
207.4 |
163.4 |
27.0% |
|
Margin (% of sales) |
49.2% |
42.3% |
|
The division’s production costs declined by 9.0% to € 156 million in the first quarter of 2013 (Q1 2012: € 172 million). This was due to positive effects from an altered product mix as well as efficiency improvements in production. Along with the increase in sales, this led to a sharp 24.0% rise in gross profit to € 266 million (Q1 2012: € 214 million) or 63.1% of sales (Q1 2012: 55.5%). With improved cost structures in place in both business units, Liquid Crystals and Pigments & Cosmetics each contributed to this positive development.
SG&A costs were up 15.5% to € 53 million (Q1 2012: € 46 million). In addition to increased marketing and selling expenses in connection with higher sales, this particularly reflects the year-on-year increase of € 4 million in one-time items from the efficiency program. R&D spending by Performance Materials rose slightly by 2.9% to € 36 million (Q1 2012: € 35 million) or 8.6% of sales (Q1 2012: 9.1%).
Owing to the excellent development of gross profit, divisional EBIT surged by 30.3% to € 173 million (Q1 2012: € 132 million) or 41.0% of sales (Q1 2012: 34.3%). Similarly strong increases were recorded for EBITDA and EBITDA pre. At € 203 million, EBITDA was 24.9% higher than in the year-ago quarter (Q1 2012: € 163 million). EBITDA pre soared by 27.0% to € 207 million (Q1 2012: € 163 million), equivalent to an EBITDA margin pre one-time items of 49.2% (Q1 2012: 42.3%).
Performance Materials | Sales by region – Q1 2013
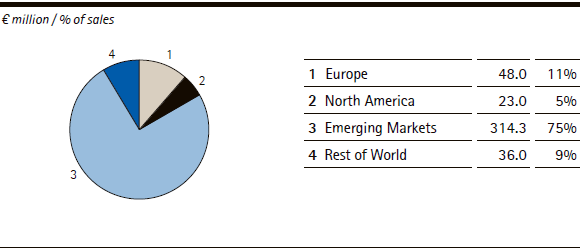
Sales development by region
In regional terms, Emerging Markets again typically generated the vast majority, or 75%, of the division’s sales, reflecting the high concentration of liquid crystal customers in Asia. With sales climbing to € 314 million (Q1 2012: € 267 million), the Emerging Markets region also posted the division’s highest organic sales growth rate of 16.9%. Once more, the rapidly advancing Chinese display industry was the main growth driver. Generating sales of € 48 million, Europe accounted for 11% of divisional sales (Q1 2012: € 47 million). Organic growth of 1.9% in the region was primarily achieved with pigments for automotive coatings and for security printing. The Rest of World region reported a sharp drop of 14.5% in organic sales to € 36 million (Q1 2012: € 48 million), corresponding to a 9% share of sales. The decline was mainly due to lower sales volumes of liquid crystal materials in Japan, underscoring the challenging display industry environment in that country. Lastly, North America accounted for € 23 million or 5% of divisional sales (Q1 2012: € 24 million). The 4% organic sales decline reflected the weaker business performance of products for the cosmetics industry.
| XLS |
|
Performance Materials | Growth components by region – Q1 2013 | |||||
|
|
|
|
|
|
|
|
|
|
|
|
|
|
|
€ million/change in % |
Sales |
Organic growth |
Exchange rate effects |
Acquisitions/ |
Reported |
|
Europe |
48.0 |
1.9% |
–0.1% |
– |
1.8% |
|
North America |
23.0 |
–4.0% |
0.4% |
– |
–3.6% |
|
Emerging Markets |
314.3 |
16.9% |
0.6% |
– |
17.5% |
|
Rest of World |
36.0 |
–14.5% |
–10.3% |
– |
–24.8% |
 search hit 10
