
In a superb second quarter of 2013, sales by the Performance Materials division increased by 1.2% to € 431 million (Q2 2012: € 426 million). While sales grew organically by 5.4%, changes in foreign exchange rates lowered top-line growth by –4.3%. Currency headwinds stemmed mainly from the Japanese yen.
Higher sales volumes of liquid crystal materials from the Liquid Crystals business unit, which accounts for more than 70% of Performance Materials sales, fueled organic growth. In particular, demand for materials based on polymer-stabilized vertical alignment (PS-VA) technology, which are primarily used in large-sized, high-quality television displays, was very strong. This compensated for moderate sales of materials based on TN-TFT technology that are typically used in monitors and notebook displays. It should also be noted that materials based on in-plane switching (IPS) technology, which are used in tablet computers, among other things, benefited at the expense of TN-TFT technology. High demand for liquid crystal materials offered by Performance Materials again underscores the technical superiority that Merck has achieved in a business driven by high quality and innovation requirements. At the same time, there have long been visible signs of an inventory buildup in the display industry value chain, which could be worked down in the second half of 2013. Merck therefore assumes a softer sales dynamic for the Performance Materials division in the second half of 2013 compared to the previous year.
The Pigments & Cosmetics business unit also recorded medium single-digit organic growth in the second quarter of 2013. This was mainly driven by higher demand for decorative pigments, particularly for Xirallic® pigments, which are primarily used in automotive coatings.
| XLS |
|
Performance Materials | Key figures | ||||||
|
|
|
|
|
|
|
|
|
|
|
|
|
|
|
|
|
€ million |
Q2 – 2013 |
Q2 – 2012 |
Change |
Jan.–June 2013 |
Jan.–June 2012 |
Change |
|
Total revenues |
431.8 |
426.6 |
1.2% |
853.9 |
812.8 |
5.0% |
|
Sales |
431.1 |
426.1 |
1.2% |
852.4 |
812.5 |
4.9% |
|
Operating result (EBIT) |
170.1 |
180.5 |
–5.7% |
342.7 |
312.9 |
9.5% |
|
Margin (% of sales) |
39.5% |
42.4% |
|
40.2% |
38.5% |
|
|
EBITDA |
205.1 |
207.5 |
–1.1% |
408.4 |
370.3 |
10.3% |
|
Margin (% of sales) |
47.6% |
48.7% |
|
47.9% |
45.6% |
|
|
EBITDA pre one-time items |
208.9 |
192.8 |
8.4% |
416.3 |
356.2 |
16.9% |
|
Margin (% of sales) |
48.5% |
45.2% |
|
48.8% |
43.8% |
|
Despite higher sales, the division’s cost of sales declined by –12.5% to € 160 million (Q2 2012: € 183 million). This was mainly due to efficiency improvements in production as well as an altered product mix. The increase in sales together with the reduction in cost of sales led to a marked rise in gross profit of 11.5% to € 271 million (Q2 2012: € 243 million). This resulted in a higher gross margin, in percent of sales, of 63.0% (Q2 2012: 57.1%), to which both the Liquid Crystals and Pigments & Cosmetics business units contributed.
Marketing and selling expenses rose slightly in the second quarter of 2013 by 4.3% to € 37 million (Q2 2012: € 35 million), while administration expenses remained at the previous year’s level of € 8 million. R&D spending rose by 4.6% to € 33 million (Q2 2012: € 32 million). The Liquid Crystals business unit accounted for the vast majority of this amount. The ratio of R&D spending to sales was thus 7.8% (Q2 2012: 7.5%). Other operating income and expenses showed a net gain of € 13 million in the year-earlier quarter and a net expense of € 19 million in the second quarter of 2013. The development of this item mainly reflects the one-time items included here. While a gain of € 16 million from the divestment of the battery electrolytes business was recorded in the previous year, the second quarter of 2013 included one-time expenses of € 3 million for restructuring measures. In the second quarter of 2013, other operating expenses additionally included impairments of € 9 million.
Due to this special situation, EBIT decreased by –5.7% to € 170 million (Q2 2012: € 181 million). EBITDA fell slightly by –1.1% to € 205 million (Q2 2012: € 207 million). Adjusted for one-time effects, EBITDA pre one-time items rose by 8.4% to € 209 million, or 48.5% of sales (Q2 2012: € 193 million or 45.2% of sales). Therefore, the division’s profitability improved to a unique level thanks to the strong operational performance of Liquid Ccrystals, particularly with regard to PS-VA technology, as well as cost structure improvements in the Pigments & Cosmetics business unit.
Performance Materials | Sales by region – Q2 2013
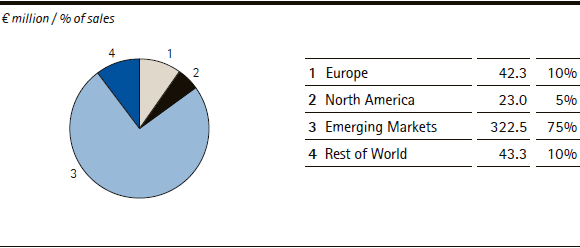
Sales development by region
From a regional perspective, the Emerging Markets region generated 75% of Performance Materials sales in the second quarter of 2013, reflecting the concentration of liquid crystals customers in Asia. This region also achieved the division’s highest organic growth rate of 5.9%. Taking negative currency effects into account, sales rose by 3.6% to € 323 million (Q2 2012: € 311 million). Once again, China was the main growth driver, where demand for flat screens climbed significantly. This was mainly due to government incentives, which ended however in the second quarter of 2013.
With sales of € 42 million, Europe accounted for 10% of divisional sales (Q2 2012: € 40 million). Organic growth of 5.5% in the region was mainly generated by pigments for automotive coatings and by cosmetic actives.
The Rest of World region, primarily Japan, also recorded an increase in organic sales, amounting to 2.9%. Strong currency headwinds of –19.7% resulted in sales of € 43 million (Q2 2012: € 52 million). The Rest of World region thus accounted for 10% of Performance Materials sales (Q2 2012: 12%).
Sales in the North America region were € 23 million (Q2 2012: € 22 million), representing a 5% share of divisional sales. Organic growth of 4.6% reflected the special regional strength of the Xirallic® business in North America.
| XLS |
|
Performance Materials | Growth components by region – Q2 2013 | |||||
|
|
|
|
|
|
|
|
|
|
|
|
|
|
|
€ million / change in % |
Sales |
Organic |
Exchange rate effects |
Acquisitions/ divestments |
Sales |
|
Europe |
42.3 |
5.5% |
–0.4% |
– |
5.1% |
|
North America |
23.0 |
4.6% |
–1.9% |
– |
2.7% |
|
Emerging Markets |
322.5 |
5.9% |
–2.3% |
– |
3.6% |
|
Rest of World |
43.3 |
2.9% |
–19.7% |
– |
–16.9% |
Half-year 2013 Performance
In the first six months of 2013, the Performance Materials division generated a 4.9% increase in sales to € 852 million (January–June 2012: € 813 million). Organically, sales grew by 7.5%. Negative currency effects of –2.6% stemmed mainly from the Japanese yen. During the first two quarters of 2013, sales volumes of liquid crystals developed favorably due to higher demand from display manufacturers. In the first six months of 2013, sales by the Pigments & Cosmetics business unit also increased. This positive performance was mainly fueled by stronger demand for Xirallic® pigments in North America as well as higher sales of active ingredients for cosmetic applications.
The division’s EBITDA pre one-time items climbed by 16.9% to € 416 million in the first half of 2013 (January–June 2012: € 356 million), reflecting both the strong performance of the Liquid Crystals business and improved earnings in the Pigments & Cosmetics business unit since the beginning of 2013. This resulted in a sharp increase in the EBITDA margin pre one-time items to 48.8% (January–June 2012: 43.8%).