

Highlights – 2nd Quarter 2013
- Organic sales growth of 3.3% despite more difficult markets
- Positive effects of efficiency program “Fit for 2018” well on track
- Margin expansion in nearly all divisions
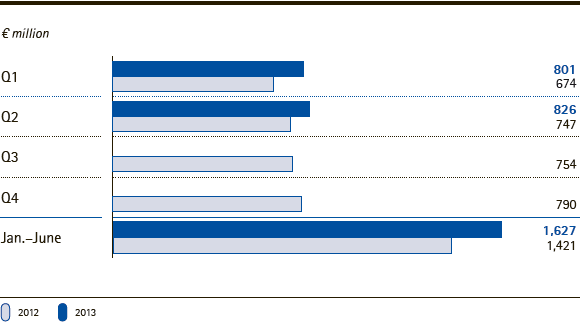
- Increase in EBITDA pre one-time items of 10.7% to € 826 million
- EPS pre one-time items lifted by 17.7% to € 2.26
- Continuous net financial debt reduction to € 1.3 billion at the end of the quarter
- Guidance for 2013 confirmed despite adverse currency effects: EBITDA pre one-time items ~€ 3.1 to € 3.2 billion
|
Merck Group | Key figures | ||||||
|
|
|
|
|
|
|
|
|
|
|
|
|
|
|
|
|
€ million |
Q2 – 2013 |
Q2 – 2012 |
Change |
Jan.–June 2013 |
Jan.–June 2012 |
Change |
|
Total revenues |
2,841.1 |
2,852.1 |
–0.4% |
5,601.6 |
5,497.1 |
1.9% |
|
Sales |
2,743.9 |
2,743.1 |
– |
5,404.3 |
5,307.0 |
1.8% |
|
Operating result (EBIT) |
465.4 |
23.2 |
n.m. |
864.8 |
333.8 |
159.1% |
|
Margin (% of sales) |
17.0% |
0.8% |
|
16.0% |
6.3% |
|
|
EBITDA |
793.1 |
375.0 |
111.5% |
1,546.9 |
1,028.3 |
50.4% |
|
Margin (% of sales) |
28.9% |
13.7% |
|
28.6% |
19.4% |
|
|
EBITDA pre one-time items |
826.4 |
746.6 |
10.7% |
1,627.5 |
1,420.9 |
14.5% |
|
Margin (% of sales) |
30.1% |
27.2% |
|
30.1% |
26.8% |
|
|
EPS pre one-time items (€) |
2.26 |
1.92 |
17.7% |
4.37 |
3.58 |
22.1% |
|
Free cash flow |
549.6 |
625.7 |
–12.1% |
988.2 |
1,045.4 |
–5.5% |
Merck’s solid business performance since the beginning of the year continued in the second quarter of 2013 with total revenues increasing organically by 2.8%. Negative currency effects of –3.4% caused total revenues of the Merck Group to fall slightly by –0.4% to € 2,841 million (Q2 2012: € 2,852 million). Acquisitions increased total revenues by 0.1%. Royalty, license and commission income, which is disclosed as part of total revenues, decreased by –10.8% to € 97 million (Q2 2012: € 109 million). This decline was mainly due to the expiry of a license agreement at Merck Serono.
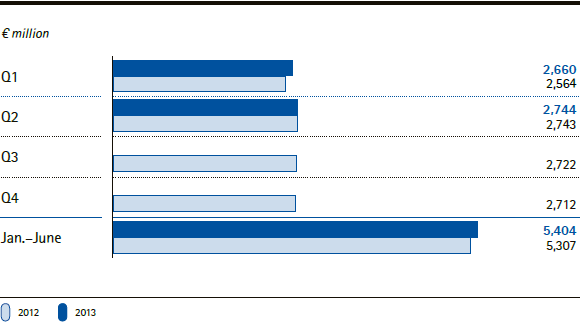
Sales (total revenues less royalty, license and commission income) grew organically by 3.3% in the second quarter of 2013 but the increase was offset by negative currency effects of –3.5%. Acquisitions contributed 0.1% to growth in sales. Overall, Group sales totaled € 2,744 million (Q2 2012: € 2,743 million). Absolute organic sales growth was driven by the solid performances of the three major divisions: Merck Serono, the largest division in terms of sales, with organic growth of 2.1%, Merck Millipore with organic growth of 5.6%, and Performance Materials with 5.4%. Currency headwinds stemmed mainly from the development of the Japanese yen. However, the Brazilian real, the Venezuelan bolivar, the Argentinean peso as well as the U.S. dollar also had a negative impact on Group sales.
Merck Group | Sales by quarter/half-year
Sales development by region
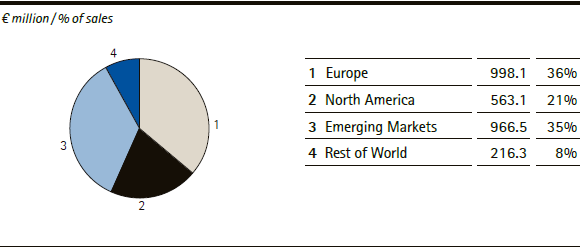
From a regional perspective, Emerging Markets, comprising Latin America and Asia with the exception of Japan, generated strong organic sales growth of 4.9%, which was largely offset by negative currency effects of –4.2%. Overall, this region’s contribution to Group sales remained constant at 35%.
Overall, sales in Europe were flat, with currency headwinds of –0.6% being compensated for by organic growth of 0.2% and an increase of 0.4% due to acquisitions. Europe thus once again accounted for 36% of Group sales in the second quarter of 2013, as in the year-earlier quarter.
With organic growth of 4.9%, North America increased its contribution to Group sales to 21% (Q2 2012: 20%). Key drivers were the strong sales performance of Merck Serono in comparison with the year-earlier quarter, especially with respect to the multiple sclerosis treatment Rebif®, as well as high customer demand in the Process Solutions business unit of Merck Millipore.
The Rest of World region, i.e. Japan, Africa and Australia/Oceania, generated 8% of Group sales in comparison with 9% in the year-earlier quarter. Negative currency effects, which totaled –15.7% and stemmed mainly from the Japanese yen, were primarily responsible for this decline. Organically, sales in the Rest of World region increased by 6.4%.
Merck Group | Sales by region – Q2 2013
| XLS |
|
Merck Group | Growth components by region – Q2 2013 | |||||
|
|
|
|
|
|
|
|
|
|
|
|
|
|
|
€ million / change in % |
Sales |
Organic |
Exchange rate effects |
Acquisitions/ divestments |
Sales |
|
Europe |
998.1 |
0.2% |
–0.6% |
0.4% |
– |
|
North America |
563.1 |
4.9% |
–2.0% |
– |
2.9% |
|
Emerging Markets |
966.5 |
4.9% |
–4.2% |
– |
0.7% |
|
Rest of World |
216.3 |
6.4% |
–15.7% |
– |
–9.2% |
|
Group |
2,743.9 |
3.3% |
–3.5% |
0.1% |
– |
Gross profit increased by 1.4%, totaling € 2,073 million (Q2 2012: € 2,044 million) or 75.6% of sales (Q2 2012: 74.5%). The gross margin improvement was mainly due to more favorable product mixes in the Merck Serono and Performance Materials divisions as well as to efficiency improvements resulting from the program “Fit for 2018” initiated last year.
Group-wide marketing and selling expenses amounted to € 616 million in the second quarter of 2013. Since they were consistent with the previous year’s level, the ratio of marketing and selling expenses to sales remained unchanged at 22.5%. Royalty, license and commission expenses increased by 3.2% to € 157 million (Q2 2012: € 152 million), which was mainly due to co-promotion expenses for Rebif® in the United States.
Other operating expenses of the Merck Group declined in the second quarter of 2013 to € 116 million (Q2 2012: € 489 million). This sharp decline primarily reflects the level of one-time items recorded here. During the second quarter of 2013, one-time items including impairments, totaled € 38 million (Q2 2012: € 394 million). One-time expenses of € 9 million were incurred in connection with “Fit for 2018” in the second quarter of 2013 (Q2 2012: € 376 million). These consisted of restructuring charges amounting to € 5 million (Q2 2012: € 355 million) and impairments totaling € 4 million (Q2 2012: € 21 million). The expenses in the year-earlier quarter were largely related to the planned closure of Merck Serono divisional headquarters in Geneva (Switzerland). In conjunction with the gain from operational currency hedges amounting to € 2 million (Q2 2012: loss of € –15 million), this reduced other operating expenses and income sharply by –76.3% to € –116 million (Q2 2012: € –489 million).
Research and development (R&D) expenses were –7.5% lower than in the second quarter of 2012 and amounted to € 374 million (Q2 2012: € 404 million) or 13.4% of sales (Q2 2012: 13.6%). The decline was largely attributable to the Merck Serono division and relates to the one-time expenses incurred in connection with the termination of two Phase III studies for Erbitux® in the previous year.
Amortization of intangible assets declined in the second quarter of 2013 by –3.7% to € 209 million (Q2 2012: € 217 million) owing to the end of the amortization period for an asset acquired within the scope of the Serono purchase.
In the second quarter of 2013, the Merck Group reported an operating result (EBIT) of € 465 million. In the year-earlier quarter, which included a very high level of one-time expenses for “Fit for 2018”, EBIT amounted to € 23 million. The operating result excluding depreciation and amortization (EBITDA) also improved markedly in comparison with the previous year, increasing by 111.5% to € 793 million (Q2 2012: € 375 million). Adjusted for one-time expenses (excluding impairments) totaling € 33 million (Q2 2012: € 372 million), the key operational performance indicator EBITDA pre one-time items grew 10.7% to € 826 million or 30.1% of sales (Q2 2012: € 747 million or 27.2% of sales). The higher margin indicates the success of the efficiency improvement efforts throughout the entire Group.
In the second quarter of 2013, the Group financial result improved by 30.4% to € –49 million (Q2 2012: € –70 million). This improvement was due to the lower interest expense for borrowed capital following the repayment of a bond worth € 500 million in December 2012 as well as foreign exchange hedging gains.
Income taxes amounted to € –101 million (Q2 2012: € –14 million), corresponding to a tax ratio of 24.2%. The tax ratio of the year-earlier quarter was significantly distorted due to the high level of one-time expenses.
Net income, i.e. profit after tax attributable to Merck shareholders, for the second quarter was € 316 million (Q2 2012: € –63 million), yielding earnings per share of € 1.45 (Q2 2012: € –0.29). It should be noted here that the previous year’s figure reflected the strong negative impact of one-time items. Adjusted for one-time charges, earnings per share before one-time items rose by 17.7% to € 2.26 (Q2 2012: € 1.92).
Merck Group | EBITDA pre one-time items by quarter/half-year
Free cash flow (net cash flow from operating activities less acquisitions/divestments, purchase/disposals of intangible assets, property, plant and equipment, and non-current financial assets) was € 550 million in the second quarter of 2013 (Q2 2012: € 626 million), which is –12.1% less than in the year-earlier quarter. The figure includes cash inflows from the sale of the buildings in Geneva. The decline mainly reflects the exceptional reduction in working capital in the previous year. Whereas free cash flow benefited by € 233 million from changes in working capital in the previous year, the decline in working capital in the second quarter of 2013 amounted to € 54 million. Working capital as of June 30, 2013 was thus 22.3% relative to sales over the past 12 months.
Half-year 2013 Performance
In the first half of 2013, total revenues of the Merck Group increased by 1.9% to € 5,602 million (January–June 2012: € 5,497 million). Organic growth and acquisitions accounted for 4.2% and 0.1%, respectively. Negative foreign exchange effects reduced total revenues by –2.4%. Above all, the development of the Japanese yen was the main reason for this, however the Latin American currencies, in particular the Brazilian real, Venezuelan bolivar and Argentinean peso, also contributed significantly to the negative currency impact. The U.S. dollar also had slightly negative effects.
Sales were up 1.8%, amounting to € 5,404 million (January–June 2012: € 5,307 million). This comprises organic growth of 4.1%, coupled with the impact of unfavorable foreign exchange developments of –2.5% as well as acquisitions, which contributed 0.1%. Following a strong start to the year, business developed moderately in the second quarter. All four divisions generated positive organic growth rates in the first six months of 2013. In particular, Performance Materials and Merck Millipore achieved notable organic growth rates of 7.5% and 4.6%, respectively. From a regional perspective, the growth of Group sales was strongest in Emerging Markets and North America, increasing by 4.8% and 4.4% to € 1,891 million and € 1,079 million, respectively (January–June 2012: € 1,804 million and € 1,034 million, respectively). This indicates the weaker economic environment in Europe and also reflects the stronger focus on markets with the most attractive growth profiles.
The operating result (EBIT) of the first six months of 2013 was € 865 million, or 16.0% of sales (January–June 2012: € 334 million or 6.3% of sales). EBITDA was 50.4% higher than in the previous year’s first six months and amounted to € 1,547 million (January–June 2012: € 1,028 million). This corresponds to an EBITDA margin of 28.6% of sales (January–June 2012: 19.4%). On a reported basis, in the first six months of 2013, one-time items of € 112 million (January–June 2012: € 424 million) were recorded including impairments of € 31 million (January–June 2012: € 31 million), and € 47 million of other one-time costs (January–June 2012: € 366 million) stemming from the Group-wide “Fit for 2018” efficiency program. Adjusted for these one-time charges, EBITDA pre one-time items for the first six months of 2013 came in at € 1,627 million (January–June 2012: € 1,421 million). Earnings per share before one-time items were € 4.37 for the first six months (January–June 2012: € 3.58), which represents an increase of 22.1%.
Free cash flow for the first half of 2013 totaled € 988 million (January–June 2012: € 1,045 million). Once again, it was used to substantially lower net financial liabilities to € 1,316 million as of June 30, 2013 (December 31, 2012: € 1,926 million).
In July 2013, the credit rating agency Moody’s Investors Service raised Merck’s long-term issuer rating to “A3” from “Baa1” with stable outlook. Having already received an “A” rating from Standard & Poor’s in May, this is the second upgrade Merck received within a period of a few weeks.
Merck Group | Number of employees as of June 30, 2013: 38,122
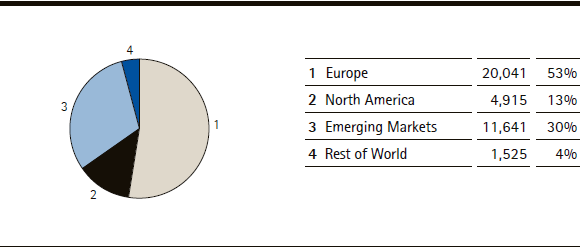
At the end of the second quarter of 2013, Merck had 38,122 employees worldwide, compared to 38,847 on December 31, 2012.
 search hit 05
