Business in the Performance Materials division again developed very favorably in the third quarter of 2013. Organically, sales declined by only –1.8% compared to the strong year-earlier quarter, thus remaining at a high level. Taking into account currency headwinds of –7.1%, divisional sales decreased by –8.9% to € 406 million (Q3 2012: € 446 million). The foreign exchange impact stemmed mainly from the Japanese yen, the Taiwanese dollar and the U.S. dollar.
The Liquid Crystals business unit, which accounts for more than 70% of divisional sales, maintained its high market share. Once again, it defended its market leadership in liquid crystal materials in the third quarter of 2013 by continuously improving its flagship technologies. Sales volumes of liquid crystal materials declined slightly compared to the year-earlier quarter, which was due to the consolidation of inventory built up in the display industry’s value chain in the past quarters. This development could possibly continue in the fourth quarter of 2013. The Liquid Crystals business unit benefited nevertheless, from the shift in demand toward technically more complex liquid crystals. These include materials based on polymer-stabilized vertical alignment (PS-VA) technology that are primarily used in large-sized, high-quality television displays, and materials based on in-plane switching (IPS) technology that are typically being used in mobile devices.
The Pigments & Cosmetics business unit recorded medium single-digit organic growth in the third quarter of 2013. This was mainly driven by higher demand for decorative pigments, particularly Xirallic® pigments, which are primarily used in automotive coatings. Thanks to the wide range of cosmetic and technical application possibilities, sales of functional materials also increased in comparison with the year-earlier quarter.
| XLS |
|
Performance Materials | Key figures | ||||||
|
|
|
|
|
|
|
|
|
|
|
|
|
|
|
|
|
€ million |
Q3 – 2013 |
Q3 – 2012 |
Change |
Jan.–Sept. |
Jan.–Sept. |
Change |
|
Total revenues |
406.7 |
446.7 |
–9.0% |
1,260.5 |
1,259.5 |
0.1% |
|
Sales |
406.5 |
446.0 |
–8.9% |
1,258.9 |
1,258.6 |
– |
|
Operating result (EBIT) |
176.6 |
163.7 |
7.9% |
519.3 |
476.6 |
9.0% |
|
Margin (% of sales) |
43.5% |
36.7% |
|
41.3% |
37.9% |
|
|
EBITDA |
202.2 |
194.5 |
4.0% |
610.6 |
564.7 |
8.1% |
|
Margin (% of sales) |
49.7% |
43.6% |
|
48.5% |
44.9% |
|
|
EBITDA pre one-time items |
196.8 |
197.3 |
–0.2% |
613.2 |
553.5 |
10.8% |
|
Margin (% of sales) |
48.4% |
44.2% |
|
48.7% |
44.0% |
|
The division’s cost of sales declined by around € –41 million, or –21.5%, to € 149 million (Q3 2012: € 189 million), which was approximately on par with the decrease in sales (€ –40 million). Consequently, gross profit was almost unchanged compared to the previous year, amounting to € 258 million (Q3 2012: € 257 million). This resulted in a gross margin, in percent of sales, of 63.5% (Q3 2012: 57.7%). The significant improvement in gross margin, to which both the Liquid Crystals and Pigments & Cosmetics business units contributed, was mainly due to a more favorable product mix in liquid crystal materials as well as efficiency improvements achieved in Pigments & Cosmetics within the scope of “Fit for 2018”.
Marketing and selling expenses fell significantly by –8.5% to € 35 million (Q3 2012: € 38 million) and administration expenses dropped by –18.3% to € 7 million (Q3 2012: € 9 million). R&D spending rose 5.2% to € 37 million (Q3 2012: € 35 million). The Liquid Crystals business unit accounted for the vast majority of this amount. Consequently, the ratio of R&D spending to sales was 9.1% (Q3 2012: 7.8%), again reflecting the high priority of research activities for the division. Other operating income and expenses showed an income balance of € 1 million (Q3 2012: expense balance of € 11 million). The development of other operating income and expenses mainly reflects one-time items. While an expense balance of € 3 million was recorded in the previous year, the third quarter of 2013 showed an income balance of € 5 million.
Due to these effects, EBIT increased by 7.9% to € 177 million (Q3 2012: € 164 million). Therefore, the percentage increase in EBITDA of 4.0% to € 202 million (Q3 2012: € 194 million) was lower than the increase in EBIT. Adjusted for one-time effects, EBITDA pre amounted to € 197 million, which was consistent with the previous year’s level. Although earnings were impacted by foreign exchange effects, the division’s profitability, i.e. the EBITDA pre margin, rose to 48.4% of sales (Q3 2012: 44.2% of sales). This was mainly attributable to changes in the product mix of the Liquid Crystals business unit as well as to resolute implementation of efficiency measures, particularly in the Pigments & Cosmetics business unit. These effects led to improved cost structures throughout the division.
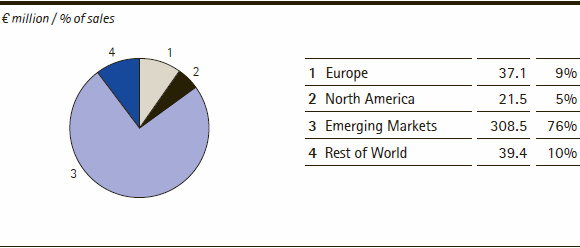
Performance Materials | Sales by region – Q3 2013
Sales development by region
From a geographic perspective, the Emerging Markets region generated 76% of Performance Materials sales in the third quarter of 2013, clearly reflecting the concentration of liquid crystals customers in Asia. Sales decreased organically by –2.3% in this region. Including a foreign exchange impact of –5.5%, sales were down –7.8% to € 309 million (Q3: 2012: € 335 million).
The Rest of World region, primarily Japan, recorded an organic sales decrease of –3.3%. Together with strong currency headwinds of –22.5%, this resulted in sales of € 39 million (Q3 2012: € 53 million). The Rest of World region’s share of sales declined from 12% in the year-earlier quarter to 10% in the third quarter of 2013.
With sales of € 37 million (Q3 2012: € 36 million), Europe accounted for 9% (Q3 2012: 8%) of divisional sales. Organic growth of 4.3% in the region was mainly generated by cosmetic active ingredients and Xirallic® pigments.
North America, where almost all sales are attributable to the Pigments & Cosmetics business unit, contributed 5% to divisional sales. Taking into account the foreign exchange impact, slight organic sales growth of 0.4% led to a decline in sales of –4.8% to € 21 million (Q3 2012: € 23 million).
| XLS |
|
Performance Materials | Growth components by region – Q3 2013 | |||||
|
|
|
|
|
|
|
|
|
|
|
|
|
|
|
€ million / change in % |
Sales |
Organic |
Exchange rate |
Acquisitions/ |
Sales |
|
Europe |
37.1 |
4.3% |
–0.7% |
– |
3.6% |
|
North America |
21.5 |
0.4% |
–5.3% |
– |
–4.8% |
|
Emerging Markets |
308.5 |
–2.3% |
–5.5% |
– |
–7.8% |
|
Rest of World |
39.4 |
–3.3% |
–22.5% |
– |
–25.8% |
|
Performance Materials |
406.5 |
–1.8% |
–7.1% |
– |
–8.9% |
Performance in the first nine months of 2013
In the first nine months of 2013, the Performance Materials division achieved organic sales growth of 4.3%, which was canceled out by negative currency effects of –4.2%. At € 1,259 million, sales remained at the previous year’s level. Sales volumes of liquid crystals developed favorably during the first half of 2013 as a result of higher demand from display manufacturers. However, in the third quarter of 2013, sales declined due to the first signs of inventory destocking in the display industry. Sales by the Pigments & Cosmetics business unit increased in the first nine months of 2013. This positive performance was fueled by stronger demand for Xirallic® pigments in North America as well as by sales growth in laser marking materials.
Thanks to the division’s strong performance in the first half of 2013, EBITDA pre one-time items rose significantly by 10.8% in the first nine months of 2013 to € 613 million (Jan.-Sept. 2012: € 553 million). The EBITDA pre margin also increased sharply to 48.7% (Jan.-Sept. 2012: 44.0%). Both the high-margin Liquid Crystals business and the earnings improvement in the Pigments & Cosmetics business unit contributed to this good performance.