
Overview – Q1 2014
- Solid organic sales growth of around 4% outweighed by currency headwinds
- All divisions contribute to organic growth
- Profitability remains high – EBITDA pre one-time items up slightly to € 807 million despite substantial reduction in royalty, license and commission income as well as negative currency impact
- Earnings per share pre one-time items up 9.5% to € 2.31
- Strong business free cash flow underscores financial strength
- High equity ratio as well as increased liquid funds reflect solid balance sheet structure
| XLS |
|
Merck Group | Key figures |
|||
|
|
|
|
|
|
|
|
|
|
|
€ million |
Q1 – 2014 |
Q1 – 2013 |
Change in % |
|
Total revenues |
2,664.8 |
2,760.5 |
–3.5 |
|
Sales |
2,613.9 |
2,660.4 |
–1.7 |
|
Operating result (EBIT) |
468.3 |
399.4 |
17.3 |
|
Margin (% of sales) |
17.9 |
15.0 |
|
|
EBITDA |
770.2 |
753.8 |
2.2 |
|
Margin (% of sales) |
29.5 |
28.3 |
|
|
EBITDA pre one-time items |
807.1 |
801.1 |
0.7 |
|
Margin (% of sales) |
30.9 |
30.1 |
|
|
Earnings per share (€) |
1.50 |
1.22 |
23.0 |
|
Earnings per share pre one-time items (€) |
2.31 |
2.11 |
9.5 |
|
Business free cash flow |
684.1 |
592.9 |
15.4 |
Development of total revenues and sales as well as results of operations
In the first quarter of 2014, total revenues of the Merck Group grew organically by 1.8%, which was outweighed by negative foreign exchange effects of –5.3%. Overall, total revenues of the Merck Group thus declined slightly by –3.5% to € 2,665 million (Q1 2013: € 2,761 million). Royalty, license and commission income, which is disclosed as part of total revenues, decreased by –49.1% to € 51 million (Q1 2013: € 100 million). This sharp drop of € –49 million was mainly due to decline in royalty and license income in the Merck Serono division.
Sales (total revenues less royalty, license and commission income) grew organically by 3.7% in the first quarter of 2014, but the increase was cancelled out by currency headwinds of –5.4%. The continued strength of the euro also led to negative exchange rate effects in the first quarter of 2014, which mainly stemmed from the U.S. dollar, the Japanese yen, and Latin American currencies. Overall, sales slipped slightly by around € –46 million in the first quarter of 2014 to € 2,614 million (Q1 2013: € 2,660 million).
| XLS |
|
Merck Group | Sales components by division – Q1 2014 |
|||||
|
|
|
|
|
|
|
|
|
|
|
|
|
|
|
€ million / change in % |
Sales |
Organic growth |
Exchange rate effects |
Acquisitions/ |
Total change |
|
Merck Serono |
1,374.9 |
4.2 |
–5.2 |
– |
–1.0 |
|
Consumer Health |
180.2 |
5.7 |
–6.5 |
– |
–0.8 |
|
Performance Materials |
402.2 |
1.1 |
–5.6 |
– |
–4.5 |
|
Merck Millipore |
656.5 |
3.7 |
–5.5 |
– |
–1.8 |
|
Merck Group |
2,613.9 |
3.7 |
–5.4 |
– |
–1.7 |
All four divisions of the Merck Group posted organic sales increases as well as negative exchange rate effects in the first quarter of 2014. Achieving an organic growth rate of 4.2%, which corresponded to an absolute increase of € 59 million, Merck Serono made the strongest absolute contribution to organic sales growth, followed by Merck Millipore with organic sales growth of € 25 million, equivalent to a growth rate of 3.7%, and Performance Materials with € 5 million, or 1.1%. With an organic sales growth rate of 5.7%, the Consumer Health division reported the highest percentage increase, corresponding to an absolute organic sales increase of € 10 million.
Merck Group | Sales by region – Q1 2014
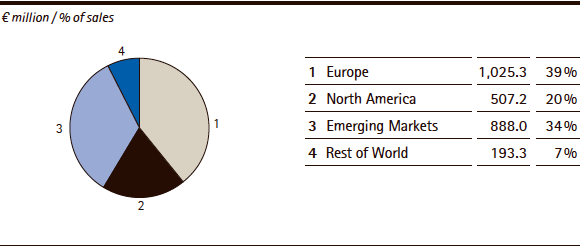
From a regional perspective, the dynamic business performance in the Emerging Markets region, which encompasses Latin America and Asia excluding Japan, contributed first and foremost to the organic growth of the Merck Group. At 5.6%, which corresponded to an absolute organic sales increase of € 52 million, the region delivered very strong organic growth, which was primarily driven by the Merck Serono and Merck Millipore divisions. Including currency headwinds of –9.5%, Group sales in the Emerging Markets region totaled € 888 million (Q1 2013: € 924 million). In the first quarter of 2014, this region’s share of Group sales declined to 34% (Q1 2013: 35%).
In Europe, organic sales growth of 1.7% was partially offset by negative currency effects of –0.5%. Sales thus increased slightly by 1.2% to € 1,025 million (Q1 2013: € 1,013 million). Consequently, Europe’s contribution to Group sales was 39% (Q1 2013: 38%).
Sales in North America amounted to € 507 million (Q1 2013: € 516 million), which represents a year-on-year decrease of –1.7%. With an organic increase in sales of 2.6% coupled with negative exchange rate effects of –4.3%, North America’s contribution to Group sales was 20% (Q1 2013: 19%).
The Rest of World region, i.e. Japan, Africa and Australia/Oceania, generated € 193 million (Q1 2013: € 207 million) or 7% of Group sales (Q1 2013: 8%). The decline in sales was largely the outcome of a substantial foreign exchange impact of –14.5% mainly attributable to the Japanese yen. With an organic sales increase of 7.8%, the region achieved the highest growth rate within the Group.
| XLS |
|
Merck Group | Sales components by region – Q1 2014 |
|||||
|
|
|
|
|
|
|
|
|
|
|
|
|
|
|
€ million / change in % |
Sales |
Organic growth |
Exchange rate effects |
Acquisitions/ |
Total change |
|
Europe |
1,025.3 |
1.7 |
–0.5 |
– |
1.2 |
|
North America |
507.2 |
2.6 |
–4.3 |
– |
–1.7 |
|
Emerging Markets |
888.0 |
5.6 |
–9.5 |
– |
–3.9 |
|
Rest of World |
193.3 |
7.8 |
–14.5 |
– |
–6.7 |
|
Merck Group |
2,613.9 |
3.7 |
–5.4 |
– |
–1.7 |
In the first quarter of 2014, the consolidated income statement of the Merck Group was as follows:
| XLS |
|
Merck Group | Consolidated Income Statement |
|||
|
|
|
|
|
|
|
|
|
|
|
€ million |
Q1 – 2014 |
Q1 – 2013 |
Change in % |
|
Sales |
2,613.9 |
2,660.4 |
–1.7 |
|
Royalty, license and commission income |
51.0 |
100.1 |
–49.1 |
|
Total revenues |
2,664.8 |
2,760.5 |
–3.5 |
|
|
|
|
|
|
Cost of sales |
–736.5 |
–724.0 |
1.7 |
|
Gross profit |
1,928.3 |
2,036.5 |
–5.3 |
|
|
|
|
|
|
Marketing and selling expenses |
–549.5 |
–568.3 |
–3.3 |
|
Royalty, license and commission expenses |
–136.4 |
–136.3 |
– |
|
Administration expenses |
–132.3 |
–132.7 |
–0.3 |
|
Other operating expenses and income |
–66.8 |
–184.0 |
–63.7 |
|
Research and development costs |
–378.9 |
–406.2 |
–6.7 |
|
Amortization of intangible assets |
–196.1 |
–209.6 |
–6.4 |
|
Operating result (EBIT) |
468.3 |
399.4 |
17.3 |
|
|
|
|
|
|
Financial result |
–34.7 |
–58.7 |
–40.8 |
|
Profit before income tax |
433.6 |
340.7 |
27.3 |
|
|
|
|
|
|
Income tax |
–106.1 |
–71.7 |
48.1 |
|
Profit after tax |
327.4 |
269.0 |
21.7 |
|
|
|
|
|
|
Non-controlling interests |
–2.2 |
–3.0 |
–25.0 |
|
Net income |
325.2 |
266.0 |
22.2 |
Including cost of sales of € 737 million (Q1 2013: € 724 million), the development of total revenues generated a gross profit of € 1,928 million for the Merck Group (Q1 2013: € 2,036 million). The –5.3% decline in gross profit was primarily due to the sharp fall in royalty, license and commission income as well as the negative impact of currency on sales. Gross margin, i.e. gross profit in percent of sales, declined accordingly by nearly 3 percentage points to 73.8% (Q1 2013: 76.5%).
The sharp drop in other operating expenses (net) by € –117 million to € 67 million (Q1 2013: € 184 million) resulted mainly from the one-time items (including impairment losses) reported under this item, which fell in the first quarter of 2014 by € 36 million to € –38 million (Q1 2013: € –74 million). Further reasons for the decline in other operating expenses included lower litigation expenses, income from the measurement of trade accounts receivable as well as gains from operational currency hedges.
The decrease in research and development costs was primarily responsible for the decline in the Group’s research spending ratio (research and development costs in percent of sales) to 14.5% (Q1 2013: 15.3%). The Merck Serono division accounted for 78.7% (Q1 2013: 79.4%) of Group-wide research and development costs.
The decline in amortization of intangible assets was primarily due to the expiration of amortization periods in the Merck Serono division.
Despite the marked drop in royalty, license and commission income, the operating result (EBIT) of the Merck Group rose sharply to € 468 million (Q1 2013: € 399 million). This was mainly due to the stable operating business, the lower level of one-time items compared to the year-earlier period, as well as the efficiency measures implemented within the scope of the “Fit for 2018” transformation and growth program.
The improvement in the financial result was due on the one hand to the positive development of the interest result and on the other to a positive measurement effect from taking into account the time value of Merck Share Units (MSUs). MSUs are virtual Merck shares that eligible executives and employees could receive at the end of a three-year performance period within the scope of the Merck Long-Term Incentive Plan.
Income tax expenses of € 106 million (Q1 2013: € 72 million) led to a tax ratio of 24.5% (Q1 2013: 21.0%). Owing to the development of expenses and income, net income attributable to Merck shareholders increased by 22.2% to € 325 million (Q1 2013: € 266 million), leading to earnings per share of € 1.50 (Q1 2013: € 1.22).
| XLS |
|
Merck Group | Reconciliation of EBIT to EBITDA pre one-time items |
|||
|
|
|
|
|
|
|
|
|
|
|
€ million |
Q1 – 2014 |
Q1 – 2013 |
Change in % |
|
Operating result (EBIT) |
468.3 |
399.4 |
17.3 |
|
Depreciation / Amortization / Reversals of impairments |
301.9 |
354.4 |
–14.8 |
|
(of which: one-time items) |
(1.3) |
(26.6) |
(–95.3) |
|
EBITDA |
770.2 |
753.8 |
2.2 |
|
Restructuring costs |
15.1 |
41.8 |
–63.9 |
|
Integration costs / IT costs |
14.4 |
5.8 |
149.1 |
|
Gains/losses on the divestment of businesses |
4.1 |
1.7 |
140.1 |
|
Acquisition costs |
1.0 |
– |
– |
|
Other one-time items |
2.3 |
–2.0 |
– |
|
EBITDA pre one-time items |
807.1 |
801.1 |
0.7 |
After adjusting for depreciation, amortization and one-time items, EBITDA pre one-time items, the key financial indicator used to steer operating business, grew slightly to € 807 million (Q1 2013: € 801 million), equivalent to an EBITDA margin pre one-time items of 30.9% (Q1 2013: 30.1%). Earnings per share pre one-time items (earnings per share adjusted by net of tax effect of one-time items and amortization of purchased intangible assets) amounted to € 2.31 in the first quarter of 2014 (Q1 2013: € 2.11).
Net assets and financial position
| XLS |
|
Merck Group | Balance sheet structure |
||||||
|
|
|
|
|
|
|
|
|
|
|
|
|
|
|
|
|
|
March 31, 2014 |
Dec. 31, 2013 |
Change |
|||
|
|
€ million |
in % |
€ million |
in % |
€ million |
in % |
|
Current assets |
7,738.9 |
36.8 |
7,384.5 |
35.5 |
354.3 |
4.8 |
|
of which: |
|
|
|
|
|
|
|
Cash and cash equivalents |
2,495.4 |
|
980.8 |
|
1,514.7 |
|
|
Current financial assets |
1,240.9 |
|
2,410.5 |
|
–1,169.5 |
|
|
Trade accounts receivable |
2,044.1 |
|
2,021.4 |
|
22.7 |
|
|
Inventories |
1,511.7 |
|
1,474.2 |
|
37.4 |
|
|
Other current assets |
446.8 |
|
497.6 |
|
–50.8 |
|
|
|
|
|
|
|
|
|
|
Non-current assets |
13,269.8 |
63.2 |
13,434.1 |
64.5 |
–164.3 |
–1.2 |
|
of which: |
|
|
|
|
|
|
|
Intangible assets |
9,688.2 |
|
9,867.2 |
|
–179.0 |
|
|
Property, plant and equipment |
2,612.2 |
|
2,647.2 |
|
–34.9 |
|
|
Other non-current assets |
969.4 |
|
919.7 |
|
49.7 |
|
|
|
|
|
|
|
|
|
|
Total assets |
21,008.6 |
100.0 |
20,818.6 |
100.0 |
190.0 |
0.9 |
|
|
|
|
|
|
|
|
|
Current liabilities |
5,113.3 |
24.3 |
3,898.8 |
18.7 |
1,214.5 |
31.2 |
|
of which: |
|
|
|
|
|
|
|
Current financial liabilities |
1,812.3 |
|
440.4 |
|
1,371.8 |
|
|
Trade accounts payable |
1,331.3 |
|
1,364.1 |
|
–32.8 |
|
|
Current provisions |
424.8 |
|
494.7 |
|
–69.9 |
|
|
Other current liabilities |
1,545.0 |
|
1,599.6 |
|
–54.6 |
|
|
|
|
|
|
|
|
|
|
Long-term liabilities |
4,652.5 |
22.1 |
5,850.6 |
28.1 |
–1,198.1 |
–20.5 |
|
of which: |
|
|
|
|
|
|
|
Non-current financial liabilities |
1,917.3 |
|
3,257.5 |
|
–1,340.2 |
|
|
Non-current provisions |
1,019.3 |
|
1,011.1 |
|
8.3 |
|
|
Provisions for pensions and other post-employment benefits |
1,083.7 |
|
910.9 |
|
172.8 |
|
|
Other non-current liabilities |
632.2 |
|
671.1 |
|
–38.9 |
|
|
|
|
|
|
|
|
|
|
Equity |
11,242.8 |
53.5 |
11,069.2 |
53.2 |
173.6 |
1.6 |
|
|
|
|
|
|
|
|
|
Total liabilities and equity |
21,008.6 |
100.0 |
20,818.6 |
100.0 |
190.0 |
0.9 |
There were no major changes in the balance sheet of the Merck Group between December 31, 2013 and March 31, 2014. Total assets increased slightly to € 21,009 million (December 31, 2013: € 20,819 million). The sharp rise in cash and cash equivalents and the corresponding decline in current financial assets relate to the purchase price payment for the acquisition of AZ Electronic Materials to be made at short notice. As of March 31, 2014, the working capital of the Merck Group increased slightly to € 2,224 million (December 31, 2013: € 2,132 million). The reclassification of financial liabilities from non-current to current was due to the maturity in March 2015 of a bond issued by Merck Financial Services with a nominal volume of € 1,350 million. At 53.5% (December 31, 2013: 53.2%), the equity ratio remained at a consistently high level.
Business free cash flow of the Merck Group amounted to € 684 million in the first quarter of 2014 (Q1 2013: € 593 million), increasing by € 91 million or 15.4%. The key to this improvement was the development of trade accounts receivable in the first quarter of 2014 as well as in the year-earlier quarter. While trade accounts receivable rose by € 23 million in the first quarter of 2014, the increase in trade accounts receivable was € 140 million in the year-earlier quarter and thus had a much stronger adverse impact on business free cash flow in the first quarter of 2013 than in the reporting period.
| XLS |
|
Merck Group | Business free cash flow |
|||
|
|
|
|
|
|
|
|
|
|
|
€ million |
Q1 – 2014 |
Q1 – 2013 |
Change in % |
|
EBITDA pre one-time items |
807.1 |
801.1 |
0.7 |
|
Investments in property, plant and equipment, software as well as advance payments for intangible assets |
–62.8 |
–42.6 |
47.4 |
|
Changes in inventories |
–37.4 |
–25.5 |
47.0 |
|
Changes in trade accounts receivable |
–22.7 |
–140.2 |
–83.8 |
|
Business free cash flow |
684.1 |
592.9 |
15.4 |