

 5
5
| XLS |
|
Consumer Health | Key figures |
|||||
|
|
|
|
|
||
|
|
|
|
|
||
|
€ million |
Q1 – 2014 |
Q1 – 2013* |
Change in % |
||
|
|||||
|
Total revenues |
180.5 |
181.8 |
–0.7 |
||
|
Sales |
180.2 |
181.7 |
–0.8 |
||
|
Operating result (EBIT) |
36.7 |
36.8 |
– |
||
|
Margin (% of sales) |
20.4 |
20.2 |
|
||
|
EBITDA |
39.1 |
39.4 |
–0.8 |
||
|
Margin (% of sales) |
21.7 |
21.7 |
|
||
|
EBITDA pre one-time items |
41.3 |
39.3 |
5.0 |
||
|
Margin (% of sales) |
22.9 |
21.6 |
|
||
|
Business free cash flow |
16.2 |
20.8 |
–22.5 |
||
Development of total revenues and sales as well as results of operations
In the first quarter of 2014, the Consumer Health division generated sales of € 180 million (Q1 2013: € 182 million). The slight decline in sales by –0.8% was primarily attributable to currency headwinds of –6.5%. Solid organic sales growth amounted to 5.7% in the first quarter. This was mainly driven by Neurobion® and Floratil®, two former Merck Serono brands that were transferred to the Consumer Health division as of January 1, 2014, as well as by Femibion® and local brands in Germany.
Consumer Health | Sales by region – Q1 2014
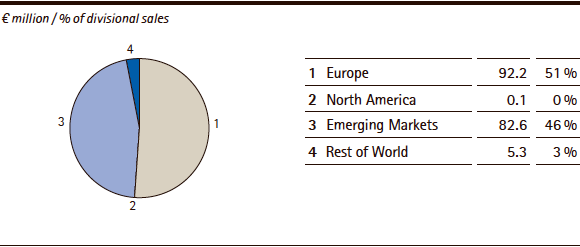
From a geographic perspective, the division’s key regions delivered solid organic sales growth rates. Europe, which accounts for 51% of sales (Q1 2013: 47%) and is the division’s largest region, posted organic sales growth as well as minor positive foreign exchange effects primarily stemming from the British pound. Sales in Europe thus increased to € 92 million (Q1 2013: € 86 million). The mild winter season led to weaker demand for Nasivin® and Bion®, which was offset by strong sales of the vitamin supplement Femibion® and local brands in Germany, as well as sales of Apaisyl®, a local French brand of insect repellent and skin care products.
In the Emerging Markets region, the division registered organic growth of 4.9%, which was mainly attributable to Neurobion®, Sangobion®, and Cebion®. In Latin America, the two new strategic brands Neurobion® and Floratil® were the primary drivers of organic growth thanks to a stronger focus on consumer-oriented marketing activities. Taking substantial currency headwinds of –12.6% into account, however, sales declined overall by –7.7% to € 83 million (Q1 2013: € 90 million). The share of divisional sales accounted for by the Emerging Markets region therefore declined to 46% (Q1 2013: 49%).
| XLS |
|
Consumer Health | Sales components by region – Q1 2014 |
|||||
|
|
|
|
|
|
|
|
|
|
|
|
|
|
|
€ million / change in % |
Sales |
Organic growth |
Exchange rate effects |
Acquisitions/ |
Total change |
|
Europe |
92.2 |
7.1 |
0.2 |
– |
7.3 |
|
North America |
0.1 |
–51.2 |
–3.0 |
– |
–54.1 |
|
Emerging Markets |
82.6 |
4.9 |
–12.6 |
– |
–7.7 |
|
Rest of World |
5.3 |
–0.7 |
–10.5 |
– |
–11.2 |
|
Consumer Health |
180.2 |
5.7 |
–6.5 |
– |
–0.8 |
The development of results of operations is presented in the following table:
| XLS |
|
Consumer Health | Results of operations |
|||||
|
|
|
|
|
||
|
|
|
|
|
||
|
€ million |
Q1 – 2014 |
Q1 – 2013* |
Change in % |
||
|
|||||
|
Sales |
180.2 |
181.7 |
–0.8 |
||
|
Royalty, license and commission income |
0.3 |
0.1 |
117.4 |
||
|
Total revenues |
180.5 |
181.8 |
–0.7 |
||
|
|
|
|
|
||
|
Cost of sales |
–59.6 |
–56.9 |
4.8 |
||
|
Gross profit |
120.9 |
124.9 |
–3.2 |
||
|
|
|
|
|
||
|
Marketing and selling expenses |
–68.1 |
–69.1 |
–1.5 |
||
|
Royalty, license and commission expenses |
0.3 |
–0.7 |
– |
||
|
Administration expenses |
–6.3 |
–5.8 |
8.5 |
||
|
Other operating expenses and income |
–4.6 |
–6.2 |
–26.2 |
||
|
Research and development costs |
–4.8 |
–5.7 |
–15.8 |
||
|
Amortization of intangible assets |
–0.7 |
–0.6 |
16.5 |
||
|
Operating result (EBIT) |
36.7 |
36.8 |
– |
||
|
Depreciation / Amortization / Reversals of impairments |
2.4 |
2.7 |
–11.1 |
||
|
(of which: one-time items) |
(–) |
(–) |
(–) |
||
|
EBITDA |
39.1 |
39.4 |
–0.8 |
||
|
Restructuring costs |
2.1 |
–0.1 |
– |
||
|
Integration costs / IT costs |
– |
– |
– |
||
|
Gains / losses on the divestment of businesses |
– |
– |
– |
||
|
Acquisition costs |
– |
– |
– |
||
|
Other one-time items |
– |
– |
– |
||
|
EBITDA pre one-time items |
41.3 |
39.3 |
5.0 |
||
The division’s gross profit declined slightly by –3.2% to € 121 million (Q1 2013: € 125 million) due to the negative impact of foreign exchange on sales as well as higher cost of sales. Consequently, the gross margin decreased to 67.1% (Q1 2013: 68.8%). The decline in other operating expenses (net) was primarily attributable to the development of provisions for litigation. In the first quarter of 2013, expenses totaling € 4 million had been incurred to set up provisions for litigation. R&D costs also developed positively as a result of measures from the “Fit for 2018” transformation and growth program. Despite the negative impact of the strong euro, the overall development of the operating result (EBIT) and EBITDA was stable. Adjusted for one-time effects from restructuring measures, EBITDA pre one-time items rose by 5.0% to € 41 million (Q1 2013: € 39 million). The EBITDA margin pre one-time items increased by more than 1 percentage point to 22.9% (Q1 2013: 21.6%).
Development of business free cash flow
In the first quarter of 2014, business free cash flow of the Consumer Health division declined by approximately € –5 million to € 16 million. This decrease was primarily attributable to the division’s inventory buildup during the first quarter of 2014, which was partially offset by the increase in EBITDA pre one-time items and the lower buildup of trade accounts receivable in the same period.
| XLS |
|
Consumer Health | Business free cash flow |
|||||
|
|
|
|
|
||
|
|
|
|
|
||
|
€ million |
Q1 – 2014 |
Q1 – 2013* |
Change in % |
||
|
|||||
|
EBITDA pre one-time items |
41.3 |
39.3 |
5.0 |
||
|
Investments in property, plant and equipment, software as well as advance payments for intangible assets |
–1.7 |
–0.6 |
186.9 |
||
|
Changes in inventories |
–10.0 |
–1.1 |
– |
||
|
Changes in trade accounts receivable |
–13.3 |
–16.7 |
–20.4 |
||
|
Business free cash flow |
16.2 |
20.8 |
–22.5 |
||
