

 4
4
| XLS |
|
Performance Materials | Key figures |
|||
|
|
|
|
|
|
|
|
|
|
|
€ million |
Q1 – 2014 |
Q1 – 2013 |
Change in % |
|
Total revenues |
402.7 |
422.1 |
–4.6 |
|
Sales |
402.2 |
421.3 |
–4.5 |
|
Operating result (EBIT) |
151.7 |
172.5 |
–12.1 |
|
Margin (% of sales) |
37.7 |
41.0 |
|
|
EBITDA |
178.8 |
203.3 |
–12.0 |
|
Margin (% of sales) |
44.5 |
48.3 |
|
|
EBITDA pre one-time items |
186.4 |
207.4 |
–10.1 |
|
Margin (% of sales) |
46.3 |
49.2 |
|
|
Business free cash flow |
165.5 |
199.0 |
–16.8 |
Development of total revenues and sales as well as results of operations
In the first quarter of 2014, the Performance Materials division achieved a slight 1.1% organic increase in sales, despite a strong year-earlier quarter. Considerable currency headwinds of –5.6%, which stemmed mainly from the U.S. dollar, the Taiwanese dollar and the Japanese yen, lowered divisional sales by a total of –4.5% to € 402 million (Q1 2013: € 421 million).
The Liquid Crystals business unit, which generates more than 70% of divisional sales, once again defended its market leadership position in liquid crystal materials in the first quarter of 2014. Overall, the two leading technologies, i.e. PS-VA and IPS, registered slight organic growth thanks to sustained high demand for displays; however, this was outweighed by negative exchange rate effects. As a result, the high year-earlier sales, which were driven by strong demand in China, among other factors, could not be fully reached.
The Pigments & Cosmetics business unit generated slight organic sales growth in the first three months of 2014. Both the good demand for decorative pigments, above all the Xirallic® pigments, which are primarily used in automotive coatings, as well as for cosmetic actives led in the first quarter of 2014 to organic sales increases. However, these increases could not fully offset the substantial negative exchange rate effects.
Performance Materials | Sales by region – Q1 2014
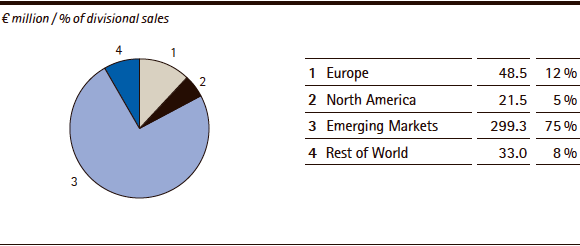
In regional terms, Emerging Markets generated the vast majority of the division’s sales, accounting for an unchanged contribution of 75%. This is due to the high concentration of liquid crystal customers in Asia. Slight organic sales growth of 0.7% was achieved in Asia despite a high year-earlier basis. Owing to negative exchange rate effects of –5.4%, sales in this region fell by € –15 million to € 299 million (Q1 2013: € 314 million).
As in the year-earlier quarter, the division posted sales of € 48 million in Europe. Consequently, this region’s share of divisional sales improved by 1 percentage point to 12% thanks to negligible exchange rate effects in comparison with other regions. Organic growth of 1.2% was due to the Pigments & Cosmetics business unit, particularly with sales of cosmetic active ingredients.
The Rest of World region, which is dominated by Japan, recorded an organic sales increase of 7.5%. Together with strong currency headwinds of –16.0%, this resulted in sales of € 33 million (Q1 2013: € 36 million). Consequently, the Rest of World region’s share of sales declined from 9% in the year-earlier quarter to 8% in the first quarter of 2014.
The North America region, where almost all sales are attributable to the Pigments & Cosmetics business unit, contributed an unchanged 5% to divisional sales. Together with the negative foreign exchange impact, the –2.8% decline in organic sales caused sales to fall by a total of –6.5% to € 22 million (Q1 2013: € 23 million).
| XLS |
|
Performance Materials | Sales components by region – Q1 2014 |
|||||
|
|
|
|
|
|
|
|
|
|
|
|
|
|
|
€ million / change in % |
Sales |
Organic growth |
Exchange rate effects |
Acquisitions/ |
Total change |
|
Europe |
48.5 |
1.2 |
–0.2 |
– |
1.0 |
|
North America |
21.5 |
–2.8 |
–3.7 |
– |
–6.5 |
|
Emerging Markets |
299.3 |
0.7 |
–5.4 |
– |
–4.7 |
|
Rest of World |
33.0 |
7.5 |
–16.0 |
– |
–8.6 |
|
Performance Materials |
402.2 |
1.1 |
–5.6 |
– |
–4.5 |
The results of operations developed as follows:
| XLS |
|
Performance Materials | Results of operations |
|||
|
|
|
|
|
|
|
|
|
|
|
€ million |
Q1 – 2014 |
Q1 – 2013 |
Change in % |
|
Sales |
402.2 |
421.3 |
–4.5 |
|
Royalty, license and commission income |
0.5 |
0.8 |
–38.1 |
|
Total revenues |
402.7 |
422.1 |
–4.6 |
|
|
|
|
|
|
Cost of sales |
–156.8 |
–156.3 |
0.3 |
|
Gross profit |
246.0 |
265.8 |
–7.5 |
|
|
|
|
|
|
Marketing and selling expenses |
–32.6 |
–35.5 |
–8.1 |
|
Royalty, license and commission expenses |
–0.7 |
–0.4 |
69.0 |
|
Administration expenses |
–7.7 |
–7.0 |
10.8 |
|
Other operating expenses and income |
–12.6 |
–10.5 |
20.1 |
|
Research and development costs |
–37.0 |
–36.4 |
1.7 |
|
Amortization of intangible assets |
–3.6 |
–3.5 |
2.3 |
|
Operating result (EBIT) |
151.7 |
172.5 |
–12.1 |
|
Depreciation / Amortization / Reversals of impairments |
27.2 |
30.8 |
–11.8 |
|
(of which: one-time items) |
(–) |
(–) |
(–) |
|
EBITDA |
178.8 |
203.3 |
–12.0 |
|
Restructuring costs |
1.8 |
3.6 |
–49.2 |
|
Integration costs / IT costs |
0.4 |
0.5 |
–20.6 |
|
Gains / losses on the divestment of businesses |
4.4 |
– |
– |
|
Acquisition costs |
1.0 |
– |
– |
|
Other one-time items |
– |
– |
– |
|
EBITDA pre one-time items |
186.4 |
207.4 |
–10.1 |
The gross profit of the division fell from € 266 million to € 246 million mainly as a result of negative foreign exchange effects. Consequently, the gross margin decreased by around 2 percentage points to 61.2% (Q1 2013: 63.1%). The decline in the operating result (EBIT) was primarily due to the development of the gross margin as well as the improvement in one-time items from € –4 million in the year-earlier quarter to € –8 million in the first quarter of 2014. Adjusted for depreciation, amortization and one-time items, EBITDA pre one-time items amounted to € 186 million in the first quarter of 2014 (Q1 2013: € 207 million), equivalent to 46.3% of sales (Q1 2013: 49.2%) and was thus around 3 percentage points lower than the record margin achieved in the year-earlier quarter.
Development of business free cash flow
In the first quarter of 2014, the Performance Materials division generated business free cash flow of € 165 million (Q1 2013: € 199 million). The decline in this key figure was primarily attributable to the lower EBITDA pre one-time items. Higher capital spending as well as the development of trade accounts receivable were also responsible for the lower level of business free cash flow compared with the year-earlier quarter.
| XLS |
|
Performance Materials | Business Free Cash Flow |
|||
|
|
|
|
|
|
|
|
|
|
|
€ million |
Q1 – 2014 |
Q1 – 2013 |
Change in % |
|
EBITDA pre one-time items |
186.4 |
207.4 |
–10.1 |
|
Investments in property, plant and equipment, software as well as advance payments for intangible assets |
–11.9 |
–9.7 |
22.3 |
|
Changes in inventories |
7.1 |
7.3 |
–3.2 |
|
Changes in trade accounts receivable |
–16.1 |
–6.0 |
167.9 |
|
Business free cash flow |
165.5 |
199.0 |
–16.8 |
