
| XLS |
|
Performance Materials | Key figures |
||||||
|
|
|
|
|
|
|
|
|
|
|
|
|
|
|
|
|
€ million |
Q3 – 2014 |
Q3 – 2013 |
Change |
Jan.–Sept. 2014 |
Jan.–Sept. 2013 |
Change |
|
Total revenues |
576.1 |
406.7 |
41.7 |
1,484.8 |
1,260.5 |
17.8 |
|
Sales |
576.1 |
406.5 |
41.7 |
1,484.0 |
1,258.9 |
17.9 |
|
Operating result (EBIT) |
152.1 |
176.6 |
–13.9 |
441.3 |
519.3 |
–15.0 |
|
Margin (% of sales) |
26.4 |
43.5 |
|
29.7 |
41.3 |
|
|
EBITDA |
217.6 |
202.2 |
7.6 |
574.5 |
610.6 |
–5.9 |
|
Margin (% of sales) |
37.8 |
49.7 |
|
38.7 |
48.5 |
|
|
EBITDA pre one-time items |
242.9 |
196.8 |
23.4 |
655.7 |
613.2 |
6.9 |
|
Margin (% of sales) |
42.2 |
48.4 |
|
44.2 |
48.7 |
|
|
Business free cash flow |
166.9 |
219.9 |
–24.1 |
511.8 |
620.8 |
–17.6 |
Development of sales and results of operations
In the third quarter of 2014, sales of the Performance Materials division soared by 41.7% to € 576 million (Q3 2013: € 406 million). Both good organic growth of 7.0% as well as acquisition-related sales increases of 35.0% or € 142 million contributed to this rise. Negative foreign exchange effects of –0.2% only had a slight impact on sales in the third quarter of 2014. Organic growth was mainly delivered by the Liquid Crystals business unit. The acquisition-related sales growth was due to the first-time consolidation on May 2, 2014 of AZ Electronic Materials, the integration of which is proceeding according to plan.
The Liquid Crystals business unit again maintained its market leadership position in liquid crystal materials in the third quarter of 2014. The two leading technologies, i.e. PS-VA and IPS, registered strong organic sales growth thanks to the continuing demand for high-quality and large-format televisions. This growth was bolstered by sales volume developments of the new UB-FFS technology, which is mainly used in smartphones and tablet PCs. Higher sales volumes were partly offset by the customary price declines in liquid crystals.
The Pigments & Cosmetics business unit posted a slight organic sales decline in the third quarter of 2014. Despite the continued strong sales performance of Xirallic® pigments, which are primarily used in automotive coatings, weaker demand for other materials led overall to slightly lower sales.
Performance Materials | Sales by region – Q3 2014
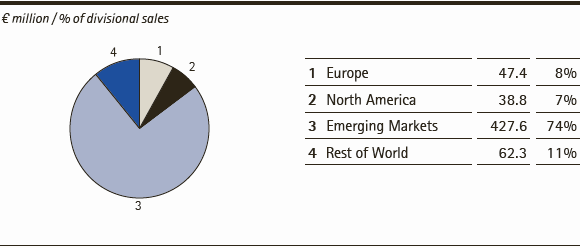
Accounting for 74% of sales (Q3 2013: 76%), the Emerging Markets region again generated the vast majority of the division’s sales. This is due to the concentration of customers for liquid crystals as well as high-tech materials from the new AZ business unit in Asia. The division achieved organic sales growth of 7.7% in this region. Sales in the Emerging Markets region rose by 30.4% due to the acquisition of AZ. Taking positive foreign exchange effects of 0.5% into account, sales in this region rose overall to € 428 million (Q3 2013: € 309 million).
The Rest of World region, which is dominated by Japan, recorded organic sales growth of 17.4%. The acquisition of AZ contributed to 48.0% of that growth. Including currency headwinds of –7.2%, this resulted in sales of € 62 million (Q3 2013: € 39 million). The share of sales attributable to the Rest of World region thus rose by one percentage point to 11%.
In the third quarter of 2014, the division posted sales of € 47 million (Q3 2013: € 37 million) in Europe. Consequently, Europe’s share of divisional sales was 8% (Q3 2013: 9%). The Pigments & Cosmetics business unit generated organic growth of 0.6%, which was due, among other things, to the demand for Xirallic® pigments. Owing to the first-time consolidation of AZ, sales in Europe increased by 26.9%. In North America, third-quarter sales soared by 80.8% to € 39 million (Q3 2013: € 21 million). This was driven by the acquisition-related sales increase of 90.7%. Organically, sales declined by –11.3% owing to weaker demand from the cosmetics industry. Consequently, the region contributed 7% to divisional sales in the third quarter of 2014 (Q3 2013: 5%).
| XLS |
|
Performance Materials | Sales components by region – Q3 2014 |
|||||
|
|
|
|
|
|
|
|
|
|
|
|
|
|
|
€ million / change in % |
Sales |
Organic growth |
Exchange |
Acquisitions/ |
Total change |
|
Europe |
47.4 |
0.6 |
0.3 |
26.9 |
27.8 |
|
North America |
38.8 |
–11.3 |
1.5 |
90.7 |
80.8 |
|
Emerging Markets |
427.6 |
7.7 |
0.5 |
30.4 |
38.6 |
|
Rest of World |
62.3 |
17.4 |
–7.2 |
48.0 |
58.1 |
|
Performance Materials |
576.1 |
7.0 |
–0.2 |
35.0 |
41.7 |
In the first nine months of 2014, divisional sales increased to € 1,484 million (Jan.–Sept. 2013: € 1,259 million). This strong growth was attributable to an organic increase of 3.3% as well as to an acquisition-related increase of 18.3%. By contrast, a negative foreign exchange impact of –3.7% lowered divisional sales. Thanks to continued strong demand from display manufacturers, sales volumes of liquid crystals developed well in the first nine months of 2014, resulting in slight organic sales growth. However, taking into account negative foreign exchange effects, which were primarily due to exchange rate developments in the first half of 2014, the Liquid Crystals business unit did not reach the previous year’s sales level. The development of sales in the Pigments & Cosmetics business unit was also impacted by negative exchange rate effects in the first nine months of 2014. Although moderate organic sales growth was achieved, this could not compensate for the adverse foreign exchange impact. Including the sales of AZ, which amounted to € 231 million for the period from May to September 2014, divisional sales rose by a total of 17.9% in the first nine months of 2014.
The results of operations developed as follows:
| XLS |
|
Performance Materials | Results of operations |
||||||||
|
|
|
|
|
|
|
|
||
|
|
|
|
|
|
|
|
||
|
€ million |
Q3 – 2014 |
Q3 – 2013 |
Change |
Jan.–Sept. 2014 |
Jan.–Sept. 20131 |
Change |
||
|
||||||||
|
Sales |
576.1 |
406.5 |
41.7 |
1,484.0 |
1,258.9 |
17.9 |
||
|
Royalty, license and |
– |
0.2 |
–81.5 |
0.8 |
1.6 |
–53.9 |
||
|
Total revenues |
576.1 |
406.7 |
41.7 |
1,484.8 |
1,260.5 |
17.8 |
||
|
|
|
|
|
|
|
|
||
|
Cost of sales1 |
–300.9 |
–148.8 |
102.3 |
–704.0 |
–465.6 |
51.2 |
||
|
(of which: amortization |
(–18.1) |
(–0.2) |
(–) |
(–19.4) |
(–0.5) |
(–) |
||
|
Gross profit1 |
275.2 |
257.9 |
6.7 |
780.8 |
794.9 |
–1.8 |
||
|
|
|
|
|
|
|
|
||
|
Marketing and selling expenses1 |
–44.9 |
–38.2 |
17.8 |
–129.5 |
–117.4 |
10.3 |
||
|
(of which: amortization |
(–3.5) |
(–3.3) |
(4.0) |
(–10.4) |
(–10.1) |
(2.8) |
||
|
Royalty, license and |
–0.6 |
–0.3 |
130.1 |
–2.3 |
–1.1 |
111.6 |
||
|
Administration expenses |
–18.4 |
–7.0 |
161.6 |
–40.9 |
–21.8 |
87.3 |
||
|
Other operating expenses and income |
–13.9 |
1.0 |
– |
–46.8 |
–28.7 |
62.9 |
||
|
Research and development costs |
–45.2 |
–36.8 |
22.8 |
–120.1 |
–106.6 |
12.6 |
||
|
Operating result (EBIT) |
152.1 |
176.6 |
–13.9 |
441.3 |
519.3 |
–15.0 |
||
|
Depreciation / Amortization / |
65.5 |
25.5 |
156.4 |
133.2 |
91.3 |
45.9 |
||
|
(of which: one-time items) |
(–) |
(–) |
(–) |
(–) |
(0.7) |
(–) |
||
|
EBITDA |
217.6 |
202.2 |
7.6 |
574.5 |
610.6 |
–5.9 |
||
|
Restructuring costs |
1.2 |
1.7 |
–31.8 |
4.5 |
8.5 |
–47.0 |
||
|
Integration costs / IT costs |
3.0 |
0.8 |
– |
4.5 |
1.9 |
135.4 |
||
|
Gains / losses on the divestment |
0.1 |
– |
– |
4.5 |
– |
– |
||
|
Acquisition costs |
21.1 |
– |
– |
67.7 |
– |
– |
||
|
Other one-time items |
– |
–7.9 |
– |
– |
–7.8 |
– |
||
|
EBITDA pre one-time items |
242.9 |
196.8 |
23.4 |
655.7 |
613.2 |
6.9 |
||
The development of results of operations was significantly influenced by the consolidation of AZ. In particular, the sharp increase in cost of sales in the third quarter of 2014 related mainly to the first-time consolidation of AZ. The AZ inventories from the acquisition were stepped up to fair values on the date of first-time consolidation. In the third quarter of 2014, € 15 million of this step-up was recognized as an expense and included in cost of sales. In addition, cost of sales rose due to the amortization of intangible assets in connection with the AZ purchase price allocation. These one-time expenses lowered the consolidated contribution of AZ to gross profit. The division’s gross margin correspondingly declined to 47.8 % (Q3 2013: 63.5%). The decrease in the operating result (EBIT) as well as EBITDA to € 152 million and € 218 million, respectively, was due among other things to the described AZ inventory revaluation, which was recognized as an expense. During the determination of EBITDA pre one-time items, this one-time effect from the inventory revaluation was added back. EBITDA pre one-time items therefore includes the adjusted amount from AZ. Including the very successful business performance of Liquid Crystals, EBITDA pre one-time items rose in the third quarter by 23.4% to € 243 million. The EBITDA margin pre one-time items fell to 42.2 % (Q3 2013: 48.4%), reflecting the lower margin of the AZ business, among other things.
Thanks to the division’s strong performance in the third quarter of 2014, EBITDA pre one-time items increased by 6.9% to € 656 million in the nine-month period. Expressed as a percentage of sales, this resulted in an EBITDA margin pre one-time items of 44.2% (Jan.–Sept. 2013: 48.7%).
Development of business free cash flow
In the third quarter of 2014, the Performance Materials division generated business free cash flow of € 167 million (Q3 2013: € 220 million). The decline of € –53 million was attributable to higher capital spending as well as the increase in inventories and trade accounts receivable.
| XLS |
|
Performance Materials | Business free cash flow |
||||||
|
|
|
|
|
|
|
|
|
|
|
|
|
|
|
|
|
€ million |
Q3 – 2014 |
Q3 – 2013 |
Change |
Jan.–Sept. 2014 |
Jan.–Sept. 2013 |
Change |
|
EBITDA pre one-time items |
242.9 |
196.8 |
23.4 |
655.7 |
613.2 |
6.9 |
|
Investments in property, plant and equipment, software as well as advance payments for intangible assets |
–27.7 |
–14.6 |
89.3 |
–58.5 |
–37.3 |
56.9 |
|
Changes in inventories |
–2.1 |
3.7 |
– |
–91.7 |
21.9 |
– |
|
Changes in trade accounts receivable |
–26.4 |
34.0 |
–177.7 |
–138.3 |
23.1 |
– |
|
Adjustments first-time consolidation of AZ Electronic Materials |
–19.8 |
– |
– |
144.6 |
– |
– |
|
Business free cash flow |
166.9 |
219.9 |
–24.1 |
511.8 |
620.8 |
–17.6 |
In the first nine months of 2014, the division generated business free cash flow of € 512 million (Jan.–Sept. 2013: € 621 million), which represented a decline of € –109 million.