

Solid growth in the Pharmaceuticals business sector
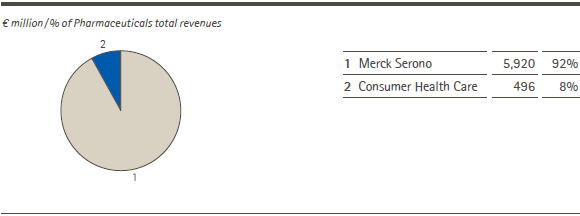
The Pharmaceuticals business sector, which comprises the Merck Serono division for innovative prescription drugs and Consumer Health Care for over-the-counter pharmaceuticals, increased its total revenues in 2011 by 3.1% to € 6,416 million. This business sector accounted for 62% of the Merck Group’s total revenues in 2011. Total revenues of the Merck Serono division increased by 2.9% and of the Consumer Health Care division by 5.1%.
Pharmaceuticals | Total revenues by division
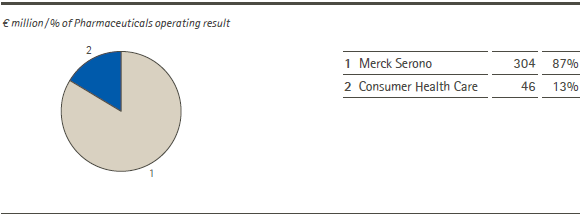
The operating result of the Pharmaceuticals business sector fell by 40% to € 350 million. The positive development of the Consumer Health Care division, which more than tripled its operating result from € 14 million to € 46 million, was overshadowed by the sharp decline of 46% in the operating result of the Merck Serono division, which totaled € 304 million. With respect to the increase in the operating result of the Consumer Health Care division, it should be noted that 2010 was adversely affected especially by restructuring charges in China as well as a warehouse fire in the United Kingdom. Apart from higher cost of sales in the Merck Serono division as well as increased R&D spending, high one-time expenses adversely affected the operating result. These related mainly to the asset impairments of the Large-Scale Biotech production plant in Switzerland, cladribine and safinamide. The underlying core operating result, which excludes Merck Serono-related amortization of intangible assets and integration costs as well as other one-time charges, increased in 2011 by 6.9% to € 1,382 million from € 1,292 million in 2010.
The Pharmaceuticals business sector generated 32% of the Group operating result (excluding Corporate and Other). Return on sales (ROS) declined sharply from 9.3% to 5.5%. Based on the underlying core operating result, the return relative to total revenues was 21.5% (2010: 20.8%).
Pharmaceuticals | Operating result by division
Chemicals business sector
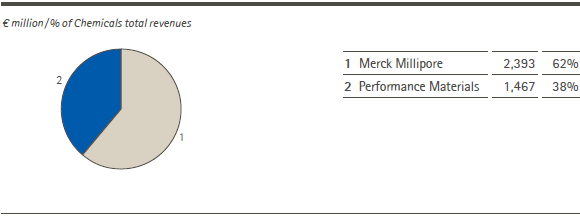
The Chemicals business sector comprises the Merck Millipore division with its three business units BioScience, Lab Solutions and Process Solutions, as well as the Performance Materials division with its two business units Liquid Crystals and Pigments & Cosmetics. In 2011, the Chemicals business sector achieved a sharp rise in total revenues, which increased by 26% to € 3,860 million. Chemicals accounted for 38% of total revenues and 68% of the operating result of the Merck Group (excluding Corporate and Other). Return on sales (ROS) decreased slightly from 20.4% to 19.5%. Total revenues of the Merck Millipore and Performance Materials divisions increased by 48% and 1.0%, respectively. However, for the Merck Millipore division, it should be noted that the Millipore companies were only included in the financial statements for six months in 2010. Organically, meaning adjusted for acquisition and exchange rate effects, total revenues of the Chemicals business sector increased by 4.2%.
Chemicals | Total revenues by division
Chemicals | Operating result by division
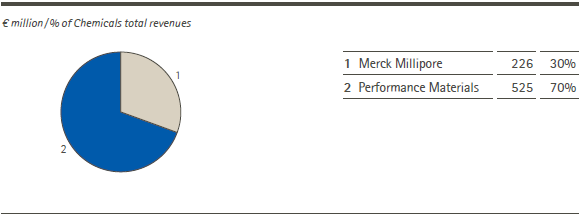
The operating result of the Chemicals business sector increased by 20% to € 751 million, with the operating result of the two divisions developing differently in 2011. While Merck Millipore increased its operating result from € 48 million to € 226 million, Performance Materials sustained a decline of 8.9% in its operating result, which totaled € 525 million.
| XLS |
|
Growth by quarter |
| |||||
|
|
|
|
|
|
|
|
|
|
|
|
|
|
|
|
|
Total revenues by quarter € million |
1st quarter |
2nd quarter |
3rd quarter |
4th quarter |
2011 |
2010 |
|
Total |
2,564 |
2,555 |
2,532 |
2,625 |
10,276 |
9,291 |
|
Pharmaceuticals |
1,544 |
1,598 |
1,602 |
1,672 |
6,416 |
6,226 |
|
Chemicals |
1,020 |
957 |
930 |
953 |
3,860 |
3,065 |
| XLS |
|
Components of growth by quarter |
| |||||
|
|
|
|
|
|
|
|
|
|
|
|
|
|
|
|
|
Change in total revenues vs. 2010 in % |
1st quarter |
2nd quarter |
3rd quarter |
4th quarter |
2011 |
2010 |
|
Organic growth |
3.1 |
5.1 |
6.9 |
3.7 |
4.8 |
7.9 |
|
Pharmaceuticals |
0.9 |
6.3 |
8.7 |
4.2 |
5.0 |
4.9 |
|
Chemicals |
9.1 |
2.4 |
3.9 |
2.7 |
4.2 |
16.9 |
|
Exchange rate effects |
3.2 |
–3.1 |
–2.2 |
–0.1 |
–0.6 |
3.7 |
|
Acquisitions/divestments |
15.8 |
13.7 |
–0.9 |
–0.5 |
6.4 |
8.4 |
|
Total |
22.1 |
15.7 |
3.8 |
3.1 |
10.6 |
19.9 |
 back
back
