In 2013, the Performance Materials division generated business free cash flow of € 788 million (2012: € 798 million). Despite a € 38 million increase in EBITDA pre one-time items and the decrease in trade accounts receivable, business free cash flow declined slightly by –1.3% due to higher capital spending and a smaller reduction in working capital. Although the two relevant balance sheet items were further reduced by € –80 million in 2013, this total nevertheless fell short of the exceptionally high reduction of € –114 million achieved in 2012.
| XLS |
|
Performance Materials | Business free cash flow |
|||
|
|
|
|
|
|
|
|
|
|
|
€ million |
2013 |
2012 |
Change in % |
|
EBITDA pre one-time items |
779.7 |
741.9 |
5.1 |
|
Investments in property, plant and equipment, software as well as advance payments for intangible assets |
–71.7 |
–57.9 |
23.8 |
|
Changes in inventories |
37.2 |
117.9 |
–68.4 |
|
Changes in trade accounts receivable |
42.6 |
–3.8 |
– |
|
Business free cash flow |
787.8 |
798.1 |
–1.3 |
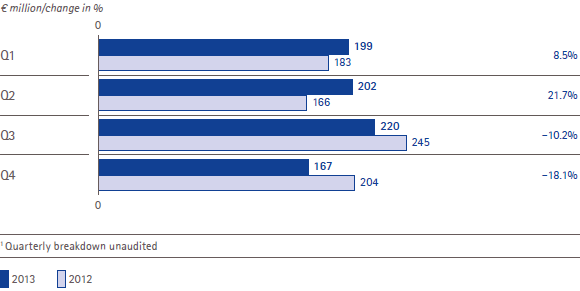
The development of business free cash flow in the individual quarters in comparison with 2012 is presented in the following table:
Performance Materials | Business free cash flow and change by quarter 1
 back
back