

In the second quarter of 2013, the Merck Millipore division achieved a 2.6% increase in sales to € 666 million (Q2 2012: € 649 million). While organically sales were up by a solid 5.6%, changes in foreign exchange rates (especially the Japanese yen) had a negative impact of –3.7%. In addition, last year’s acquisition of Biochrom AG, Berlin, favorably impacted sales by 0.6%. The division reported positive organic growth across the three business units. Royalty income from pharmaceutical-chemical products from Process Solutions decreased in the second quarter to € 2 million (Q2 2012: € 6 million).
The Process Solutions business unit, which markets products and services for the pharmaceutical production value chain, was the primary contributor of the top line growth in the second quarter 2013. As a result of higher volumes, Process Solutions reported organic sales growth of 7.7% reaching sales of € 277 million (Q2 2012: € 262 million). Therefore, the business unit now accounts for 42% of the division’s sales (Q2 2012: 40%). The increase was driven by higher demand for products used in biopharmaceutical production as well as the business unit’s biodevelopment services that promote single-use manufacturing (for example Mobius®). Growth was also fueled by the very positive development of sales to the pharmaceutical industry during the quarter, especially in North America and western Europe. With an increasing number of research projects in the pharmaceutical industry, Merck Millipore continues to expect that the Process Solutions business unit will remain a major growth driver for the division.
In the Lab Solutions business unit, where Merck Millipore markets a broad portfolio of products used by researchers and scientific laboratories, sales increased organically by 5.8% to € 279 million (Q2 2012: € 274 million). This was mainly driven by elevated demand for biomonitoring solutions, particularly from customers in the pharmaceutical industry, Lab Water services and consumables and strong demand in mature markets. Higher selling prices also contributed to the increase.
The Bioscience business unit, which primarily markets products and services for biotech research laboratories, recorded organic sales growth of 0.6% to € 110 million (Q2 2012: € 113 million). On the one hand, across-the-board health care spending cuts in the United States softened demand. On the other hand, business with the recently launched system series Amnis®, Muse® and Direct Detect® developed favorably and compensated for the decline in sales with services for active ingredient development.
| XLS |
|
Merck Millipore | Key figures | ||||||
|
|
|
|
|
|
|
|
|
|
|
|
|
|
|
|
|
€ million |
Q2 – 2013 |
Q2 – 2012 |
Change |
Jan.–June 2013 |
Jan.–June 2012 |
Change |
|
Total revenues |
668.7 |
655.3 |
2.1% |
1,343.3 |
1,310.7 |
2.5% |
|
Sales |
666.3 |
649.5 |
2.6% |
1,335.0 |
1,302.1 |
2.5% |
|
Operating result (EBIT) |
72.4 |
70.3 |
3.0% |
144.8 |
153.1 |
–5.5% |
|
Margin (% of sales) |
10.9% |
10.8% |
|
10.8% |
11.8% |
|
|
EBITDA |
148.2 |
146.2 |
1.4% |
299.7 |
304.7 |
–1.6% |
|
Margin (% of sales) |
22.2% |
22.5% |
|
22.5% |
23.4% |
|
|
EBITDA pre one-time items |
155.9 |
152.9 |
1.9% |
317.8 |
319.0 |
–0.4% |
|
Margin (% of sales) |
23.4% |
23.5% |
|
23.8% |
24.5% |
|
During the second quarter of 2013, cost of sales amounted to € 286 million (Q2 2012: € 270 million), which represents a year-on-year increase of 5.9%. This yielded a gross profit of € 383 million (Q2 2012: € 385 million), or 57.5% of sales (Q2 2012: 59.3%). The decrease in gross margin was attributable to currency headwinds (especially from a weaker Japanese yen) and changes in product mix.
Marketing and selling expenses rose by 2.9% to € 174 million (Q2 2012: € 169 million), primarily as a result of expanding the sales organizations in the Emerging Markets region and sales promotion campaigns. By contrast, administration expenses dropped in the second quarter of 2013 by –14.3% to € 23 million (Q2 2012: € 27 million), reflecting the positive effects of the “Fit for 2018” efficiency program. Other operating expenses totaled € 20 million (Q2 2012: € 23 million), including € 8 million in one-time items (Q2 2012: € 7 million).
Merck Millipore’s R&D costs decreased by –5.0% as a result of foreign exchange effects and phasing in development projects, to € 40 million (Q2 2012: € 42 million). In the second quarter of 2013, the ratio of R&D costs to sales was 5.9%. The division will nevertheless continue to strengthen its investments in developing innovative products in order to participate in the attractive growth opportunities of the life science tools market. The Process Solutions business unit thus accounts for a significant portion of the R&D budget.
Lastly, EBIT increased by 3.0% to € 72 million (Q2 2012: € 70 million), while EBITDA rose 1.4% to € 148 million (Q2 2012: € 146 million). Adjusted for one-time charges of € 8 million (Q2 2012: € 7 million), EBITDA pre rose by 1.9% to € 156 million, or 23.4% of sales (Q2 2012: € 153 million, 23.5% of sales).
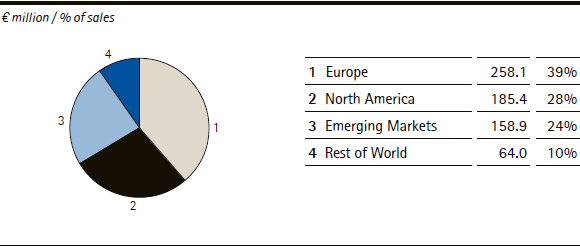
Merck Millipore | Sales by region – Q2 2013
Sales development by region
In the second quarter of 2013, all regions recorded positive organic growth rates. Europe and North America were the strongest sales regions with the highest growth rates. Accounting for 39% of divisional sales (Q2 2012: 37%), Europe, which is the division’s largest geographic market, reported organic sales growth of 7.4% to € 258 million (Q2 2012: € 238 million), mainly driven by strong demand for products from the Process Solutions and Bioscience business units.
In North America, higher demand for drug manufacturing products clearly offset weaker demand for laboratory materials from the Bioscience business unit, which was affected by government budget cuts in the United States. Sales in this region rose to € 185 million (Q2 2012: € 176 million). While organically sales were up 7.6%, foreign exchange lowered sales by –2.1% which translated in reported growth of 5.5%.
With organic growth of 3.4% and a negative foreign exchange impact of –3.1%, the Emerging Markets region generated sales of € 159 million (Q2 2012: € 158 million), fueled by strong demand for products from the Lab Solutions business unit. Consequently, this region’s share of Merck Millipore’s sales remained unchanged at 24%.
As a result of significant currency headwinds of –17.7%, especially relative to the Japanese yen, sales in the Rest of World region declined to € 64 million (Q2 2012: € 77 million). With slight organic growth of 0.7%, this region’s share of the division’s sales declined to 10% (Q2 2012: 12%).
| XLS |
|
Merck Millipore | Growth components by region – Q2 2013 | |||||
|
|
|
|
|
|
|
|
|
|
|
|
|
|
|
€ million / change in % |
Sales |
Organic |
Exchange rate effects |
Acquisitions/ divestments |
Sales |
|
Europe |
258.1 |
7.4% |
–0.7% |
1.6% |
8.2% |
|
North America |
185.4 |
7.6% |
–2.1% |
– |
5.5% |
|
Emerging Markets |
158.9 |
3.4% |
–3.1% |
0.2% |
0.5% |
|
Rest of World |
64.0 |
0.7% |
–17.7% |
– |
–17.0% |
Half-year 2013 Performance
In the first half of 2013, Merck Millipore’s total revenues grew by 2.5% to € 1,343 million (January–June 2012: € 1,311 million), including € 8 million from royalties (Jan.-June 2012: € 9 million). Sales increased by 2.5% to € 1,335 million (Jan.-June 2012: € 1,302 million). Organic growth of 4.6% in the Merck Millipore division was fueled by the good performance of the Process Solutions business unit and a decent performance of Lab Solutions, partially offset by the negative foreign exchange impact of –2.6%. Last year’s acquisition of Biochrom AG contributed 0.6% to the reported sales increase.
Merck Millipore’s EBITDA pre declined slightly by –0.4% to € 318 million (January–June 2012: € 319 million). This was primarily the result of increased marketing and selling expenses, higher R&D costs and currency headwinds (especially from a weaker Japanese yen). EBITDA margin pre one-time items amounted to 23.8% of sales, which was slightly lower than in the year-ago period (Jan.-June 2012: 24.5%).
 back
back
