

Highlights – 3rd Quarter 2013
- Accelerated implementation of efficiency measures
- Solid organic sales growth of ~ 5%
- Significant increase in EBITDA pre one-time items powered by structural improvements from the “Fit for 2018” transformation program and despite negative currency impacts
- Merck Serono: Strong organic sales performance of 5.2% driven by Emerging Markets and Japan
- Consumer Health: Turnaround on track underlined by strong earnings in Q3 2013
- Performance Materials: Solid development despite first signs of inventory destocking in the display industry
- Merck Millipore: Excellent business performance thanks to its balanced portfolio
- Earnings per share pre one-time items up 15.7% to € 2.29
- Significant net financial debt reduction to € 0.5 billion at the end of the quarter
- Guidance raised for FY 2013: EBITDA pre one-time items ~ € 3.2 billion – € 3.25 billion
| XLS |
|
Merck Group | Key figures | ||||||
|
|
|
|
|
|
|
|
|
|
|
|
|
|
|
|
|
€ million |
Q3 – 2013 |
Q3 – 2012 |
Change |
Jan.–Sept. |
Jan.–Sept. |
Change |
|
Total revenues |
2,751.8 |
2,841.0 |
–3.1% |
8,353.4 |
8,338.1 |
0.2% |
|
Sales |
2,659.5 |
2,721.7 |
–2.3% |
8,063.8 |
8,028.7 |
0.4% |
|
Operating result (EBIT) |
481.8 |
318.1 |
51.4% |
1,346.6 |
651.9 |
106.6% |
|
Margin (% of sales) |
18.1% |
11.7% |
|
16.7% |
8.1% |
|
|
EBITDA |
796.4 |
661.0 |
20.5% |
2,343.4 |
1,689.4 |
38.7% |
|
Margin (% of sales) |
29.9% |
24.3% |
|
29.1% |
21.0% |
|
|
EBITDA pre one-time items |
830.7 |
754.2 |
10.1% |
2,458.1 |
2,175.1 |
13.0% |
|
Margin (% of sales) |
31.2% |
27.7% |
|
30.5% |
27.1% |
|
|
EPS pre one-time items (€) |
2.29 |
1.98 |
15.7% |
6.66 |
5.56 |
19.8% |
|
Free cash flow |
743.8 |
814.8 |
–8.7% |
1,732.0 |
1,860.2 |
–6.9% |
Merck’s solid business performance in the first half continued in the third quarter of 2013 with total revenues increasing organically by 3.6%. Currency headwinds of –6.9% caused total revenues of the Merck Group to decrease by –3.1% to € 2,752 million (Q3 2012: € 2,841 million). Acquisitions increased total revenues by 0.2%. Royalty, license and commission income, which is disclosed as part of total revenues, fell by –22.7% to € 92 million (Q3 2012: € 119 million). This decline was primarily due to the expiration of a licensing agreement within the Merck Serono division.
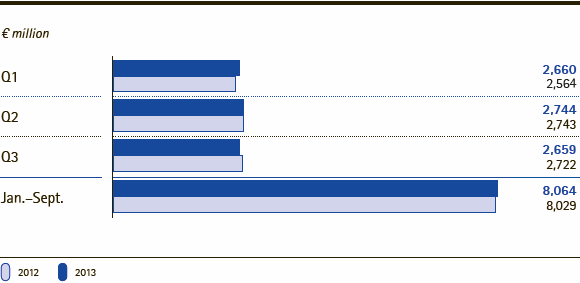
Sales (total revenues less royalty, license and commission income) grew organically by 4.7% in the third quarter of 2013 but the increase was more than offset by foreign exchange effects of –7.1%. As was the case in the first half of 2013, the strong euro led to significant negative exchange rate effects that burdened all four divisions. Above all, the exchange rate developments of the Japanese yen, U.S. dollar as well as Latin American currencies were responsible for this. Acquisitions increased sales by 0.2%. Overall, Group sales totaled € 2,659 million (Q3 2012: € 2,722 million).
Three of the four divisions achieved sound organic sales growth in the third quarter of 2013 with the greatest absolute contributions coming from Merck Serono, which accounts for the majority of Group sales and reported organic growth of 5.2%, as well as Merck Millipore with organic sales growth of 5.9%. The Consumer Health division generated organic growth of 14.6%.
Merck Group | Sales by quarter/Jan.-Sept.
Sales development by region
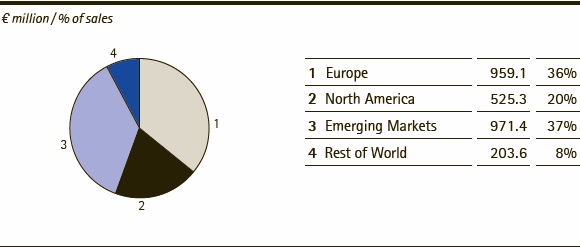
Geographically, the Emerging Markets region, which comprises Latin America and Asia excluding Japan, delivered excellent organic sales growth of 11.5% to become the region accounting for the highest proportion of Group sales as of the third quarter of 2013. In particular, the Merck Serono division was responsible for the excellent organic growth in this region. Including a foreign exchange impact of –10.7%, sales amounted to € 971 million (Q3 2012: € 964 million). Consequently, the share of Group sales generated in this region, increased by two percentage points to 37%.
Overall, Europe saw a slight increase in sales, with negative exchange rate effects and organic growth offsetting each other. Acquisitions contributed 0.4% to sales. With sales of € 959 million (Q3 2012: € 956 million), Europe’s contribution to Group sales was 36% in the third quarter of 2013 (Q3 2012: 35%).
Sales in North America amounted to € 525 million, declining by –6.6% compared to the strong year-earlier quarter. With sales slipping organically by –1.3% coupled with negative exchange rate effects of –5.2%, this region’s contribution to Group sales was 20% (Q3 2012: 21%). High customer demand in the Process Solutions und Lab Solutions business units of Merck Millipore could not compensate for the decline in sales by the Merck Serono division, especially with respect to the multiple sclerosis treatment Rebif®.
The Rest of World region, i.e. Japan, Africa and Australia/Oceania, generated 8% of Group sales compared to still 9% in the year-earlier quarter. This decline was largely the outcome of a substantial foreign exchange impact of –20.8% mainly attributable to the Japanese yen. Organic growth of 5.7% was primarily generated by the Merck Serono division with the oncology drug Erbitux®.
Merck Group | Sales by region – Q3 2013
| XLS |
|
Merck Group | Growth components by region – Q3 2013 | |||||
|
|
|
|
|
|
|
|
|
|
|
|
|
|
|
€ million / change in % |
Sales |
Organic |
Exchange rate |
Acquisitions/ |
Sales |
|
Europe |
959.1 |
1.1% |
–1.1% |
0.4% |
0.4% |
|
North America |
525.3 |
–1.3% |
–5.2% |
– |
–6.6% |
|
Emerging Markets |
971.4 |
11.5% |
–10.7% |
– |
0.8% |
|
Rest of World |
203.6 |
5.7% |
–20.8% |
– |
–15.1% |
|
Merck Group |
2,659.5 |
4.7% |
–7.1% |
0.2% |
–2.3% |
Cost of sales of the Merck Group fell by –8.2% to € 723 million (Q3 2012: € 788 million). Together with the decrease in royalty, license and commission income, this led to a slight –1.2% decline in gross profit to € 2,028 million (Q3 2012: € 2,053 million). However, gross margin, i.e. gross profit in percent of sales, grew by nearly one percentage point to 76.3% (Q3 2012: 75.4%). This expansion is primarily due to efficiency improvements from the “Fit for 2018” program launched in 2012 as well as to a more favorable product mix, especially in the Liquid Crystals business unit.
In the third quarter of 2013, Group marketing and selling expenses were reduced by –6.3% to € 560 million (Q3 2012: € 598 million). Likewise, Group administration expenses declined by –3.4% to € 137 million (Q3 2012: € 142 million). Besides currency effects, this illustrates the accelerated implementation of the efficiency measures. The decline in marketing and selling expenses was mainly attributable to the Merck Serono division. Consequently, the proportion of these expenses to sales declined to 21.1% (Q3 2012: 22.0%). Royalty, license and commission expenses decreased by –10.7% to € 144 million (Q3 2012: € 162 million), which was mainly due to lower co-promotion expenses for Rebif® in the United States.
Other operating expenses of the Merck Group fell in the third quarter of 2013 to € 128 million (Q3 2012: € 245 million). Among other things, this sharp decline was due to the one-time items recorded in this line. In the third quarter of 2013, one-time items including impairments, totaled € 49 million (Q3 2012: € 104 million). This figure also included restructuring charges of € 33 million in connection with the transformation program “Fit for 2018”. In the year-earlier quarter, this program led to one-time expenses of € 45 million, which comprised restructuring charges of € 43 million and impairments of € 2 million. The decline in other operating expenses was also due to lower litigation expenses as well as gains from operational currency hedges. In the third quarter of 2013, the foreign currency result showed a gain of € 8 million (Q3 2012: loss of € 21 million). This was primarily attributable to cash flow hedges.
Research and development (R&D) expenses increased slightly by 2.3% compared to the third quarter of 2012, amounting to € 379 million (Q3 2012: € 371 million) or 14.3% of sales (Q3 2012: 13.6%). The Merck Serono division accounted for 78.4% (Q3 2012: 77.5%) of the Group’s total research and development expenses.
Amortization of intangible assets declined in the third quarter of 2013 by –9.4% to € 198 million (Q3 2012: € 218 million) owing to the end of the amortization period for two assets acquired within the scope of the Serono purchase.
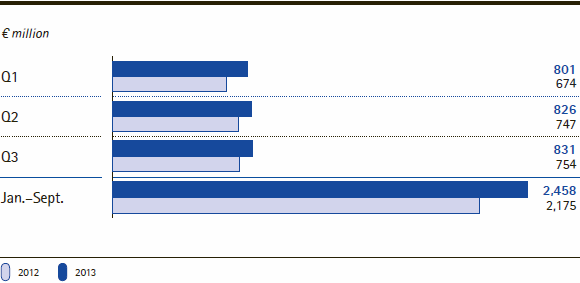
In the third quarter of 2013, the Merck Group reported a significant increase of 51.4% in the operating result (EBIT) to € 482 million (Q3 2012: € 318 million). The operating result excluding depreciation and amortization (EBITDA) also improved markedly compared to the previous year, increasing by 20.5% to € 796 million (Q3 2012: € 661 million). Adjusted for one-time expenses (excluding impairments) totaling € 34 million (Q3 2012: € 93 million), EBITDA pre one-time items, the key financial indicator used to steer operating business, grew 10.1% to € 831 million or 31.2% of sales (Q3 2012: € 754 million or 27.7% of sales). The considerable profitability improvement of 3.5 percentage points was mainly the result of solid organic growth and strict cost control.
Merck Group | EBITDA pre one-time items by quarter/Jan.-Sept.
In the third quarter of 2013, the Group financial result improved by 10.9% to € –52 million (Q3 2012: € –58 million). This mainly reflects the lower interest expense on borrowed capital following the sharp decline in net financial debt.
Income taxes amounted to € –87 million (Q3 2012: € –71 million), leading to a tax ratio of 20.3% (Q3 2012: 27.4%).
Net income, i.e. profit after tax attributable to Merck shareholders, for the third quarter of 2013 was € 340 million (Q3 2012: € 185 million), yielding earnings per share of € 1.56 (Q3 2012: € 0.85). Earnings per share before one-time items rose by 15.7% to € 2.29 (Q3 2012: € 1.98).
Free cash flow amounted to € 744 million in the third quarter of 2013 (Q3 2012: € 815 million), once again reaching an excellent level. In comparison with the very high level of free cash flow in the year-earlier quarter, the decline was only –8.7%. This decrease in free cash flow is primarily attributable to the effect of the sharp reduction in working capital, which generated very high cash inflows of € 203 million in the year-earlier quarter. A further decline in working capital in the third quarter of 2013 positively affected free cash flow by € 69 million. As of September 30, 2013, working capital amounted to € 2,290 million (December 31, 2012: € 2,360 million), corresponding to 21.3% (December 31, 2012: 22.0%) of sales over the past 12 months.
Performance in the first nine months of 2013
In the period from January to September 2013, total revenues of the Merck Group increased slightly by 0.2% to € 8,353 million (Jan.-Sept. 2012: € 8,338 million). Organic growth and acquisitions accounted for 4.0% and 0.1%, respectively. Negative foreign exchange effects decreased total revenues by –3.9%. Above all, the exchange rate development of the Japanese yen was the main reason for this, however Latin American currencies and the U.S. dollar also contributed to the negative currency impact.
Sales were up 0.4%, amounting to € 8,064 million (Jan.-Sept. 2012: € 8,029 million). This reflected organic growth of 4.3%, coupled with the effects of unfavorable exchange rate developments of –4.0% as well as acquisitions, which contributed 0.1%. All four divisions generated positive organic growth rates in the first nine months of 2013. In particular, Consumer Health and Merck Millipore achieved notable organic growth rates of 7.6% and 5.0%, respectively, owing to a good third quarter.
From a geographic perspective, at 9.2% organic sales growth was strongest in the Emerging Markets region. Including negative exchange rate effects, sales totaled € 2,862 million (Jan.-Sept. 2012: € 2,768 million). Consequently, the share of Group sales generated by the Emerging Markets region rose to 36%, underscoring the stronger business focus on these attractive growth markets.
In the first nine months of 2013, the Merck Group generated an operating result (EBIT) of € 1,347 million, more than doubling the operating result of the year-earlier period (Jan.-Sept. 2012: € 652 million). EBITDA was 38.7% higher than in the first nine months of 2012 and amounted to € 2,343 million (Jan.-Sept. 2012: € 1,689 million). This yielded an EBITDA margin of 29.1% (Jan.-Sept. 2012: 21.0%). On a reported basis, in the first nine months of 2013, one-time items of € 161 million (Jan.-Sept. 2012: € 528 million) were recorded including impairments of € 46 million (Jan.-Sept. 2012: € 42 million). One-time items include in particular restructuring charges in connection with the “Fit for 2018” efficiency program amounting to € 110 million (Jan.-Sept. 2012: € 432 million). Adjusted for these one-time effects, EBITDA pre one-time items in the first nine months of 2013 rose notably by 13.0% to € 2,458 million or 30.5% of sales (Jan.-Sept. 2012: € 2,175 million or 27.1% of sales). This profitability improvement is largely due to good business performance as well as cost savings achieved as a result of the accelerated implementation of efficiency measures. Earnings per share pre one-time items surged by 19.8%, coming in at € 6.66 (Jan.-Sept. 2012: € 5.56).
Free cash flow in the first nine months of 2013 totaled € 1,732 million, nearly reaching the very high year-earlier level (Jan.-Sept. 2012: € 1,860 million). The strong cash flow from operating activities was used in particular to repay financial liabilities, thereby considerably lowering net financial debt to € 536 million as of September 30, 2013 (December 31, 2012: € 1,926 million).
Merck Group | Number of employees as of Sept. 30, 2013: 37,976
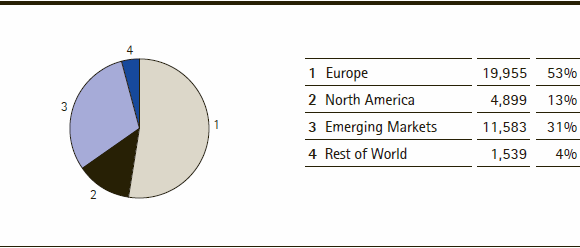
As of September 30, 2013, Merck had 37,976 employees worldwide compared to 38,847 on December 31, 2012.
 back
back
