

| XLS |
|
Merck Serono | Key figures |
|||||
|
|
|
|
|
||
|
|
|
|
|
||
|
€ million |
Q1 – 2014 |
Q1 – 2013* |
Change in % |
||
|
|||||
|
Total revenues |
1,421.1 |
1,482.1 |
–4.1 |
||
|
Sales |
1,374.9 |
1,388.8 |
–1.0 |
||
|
Operating result (EBIT) |
235.8 |
170.2 |
38.5 |
||
|
Margin (% of sales) |
17.2 |
12.3 |
|
||
|
EBITDA |
428.0 |
408.3 |
4.8 |
||
|
Margin (% of sales) |
31.1 |
29.4 |
|
||
|
EBITDA pre one-time items |
438.0 |
437.7 |
0.1 |
||
|
Margin (% of sales) |
31.9 |
31.5 |
|
||
|
Business free cash flow |
480.0 |
340.0 |
41.2 |
||
Development of total revenues and sales as well as results of operations
In the first quarter of 2014, total revenues of the Merck Serono division grew organically by 0.8%.
However, owing to negative foreign exchange effects amounting to –5.0%, total revenues of the division declined by –4.1% to € 1,421 million (Q1 2013: € 1,482 million). Despite solid organic growth of 4.2%, sales slipped by –1.0% to € 1,375 million (Q1 2013: € 1,389 million) since the strong euro led to negative foreign exchange effects of –5.2%. All therapeutic areas contributed to the organic sales growth of the division. Among others, the portfolio for the treatment of thyroid disorders performed well in the first quarter of 2014, as did Gonal-f®, the leading recombinant hormone used in the treatment of infertility. Royalty, license and commission income, which along with sales is reported as part of total revenues, fell sharply by –50.4% to € 46 million (Q1 2013: € 93 million). This was due primarily to lower royalty and license income from Avonex®, Enbrel® and Humira®. The agreement reached with Bristol-Myers Squibb in 2013 on the co-promotion of Glucophage® in China positively impacted commission income in the first quarter of 2014 compared with the year-earlier quarter.
Merck Serono | Sales by region – Q1 2014
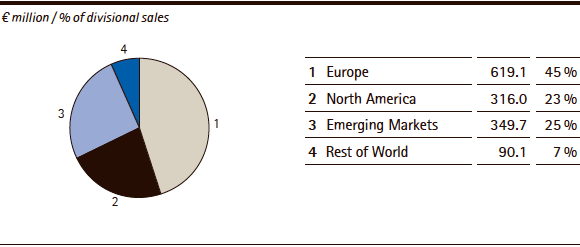
Europe, the division’s top-selling region, posted a slight organic sales decline of –0.2% and a negative foreign exchange impact of –0.8%, thereby generating sales of € 619 million (Q1 2013: € 625 million). At 45%, Europe accounted for the largest proportion of the division’s sales, as in 2012.
Emerging Markets, the division’s second-largest region by sales, posted organic growth of 6.7%, and a substantial negative foreign exchange impact of –11.3%. Consequently, sales decreased to € 350 million from € 366 million. This region’s share of divisional sales declined from 26% in the year-earlier quarter to 25% in the first quarter of 2014. China as well as Latin American countries were the main contributors to organic growth.
In the first quarter of 2014, sales in North America amounted to € 316 million, increasing by 3.9% compared to the year-earlier quarter (€ 304 million). This reflects an organic sales increase of 8.7% and unfavorable foreign exchange effects of –4.7%. The sharp organic increase in sales was mainly due to the performance of Rebif® in the United States. The North America region contributed 23% (Q1 2013: 22%) to the division’s sales.
Sales in the Rest of World region grew organically by 9.5% in the first quarter of 2014. However, considerable currency headwinds of –13.1% caused sales to decline to € 90 million (Q1 2013: € 94 million). Sales developed positively particularly in Japan with the oncology drug Erbitux®. Once again, the Rest of World region contributed 7% to divisional sales.
| XLS |
|
Merck Serono | Sales components by region – Q1 2014 |
|||||
|
|
|
|
|
|
|
|
|
|
|
|
|
|
|
€ million / change in % |
Sales |
Organic growth |
Exchange rate effects |
Acquisitions/ |
Total change |
|
Europe |
619.1 |
–0.2 |
–0.8 |
– |
–0.9 |
|
North America |
316.0 |
8.7 |
–4.7 |
– |
3.9 |
|
Emerging Markets |
349.7 |
6.7 |
–11.3 |
– |
–4.6 |
|
Rest of World |
90.1 |
9.5 |
–13.1 |
– |
–3.6 |
|
Merck Serono |
1,374.9 |
4.2 |
–5.2 |
– |
–1.0 |
In the first quarter of 2014, sales of the two top-selling products of the Merck Serono division developed as follows:
Rebif®, which is used to treat relapsing forms of multiple sclerosis, achieved organic growth of 5.3% in the first quarter of 2014 despite the increasingly difficult competitive situation. Including foreign exchange effects of –4.1%, Rebif® sales rose overall by 1.2% to € 459 million (Q1 2013: € 454 million). This positive development was mainly driven by the North America region, which is the largest market for Rebif®, accounting for 53% (Q1 2013: 49%) of this product’s total sales. In this region, price increases as well as restocking by pharmaceutical wholesalers resulted in a 12.2% organic increase in sales, which amounted to € 242 million (Q1 2013: € 225 million). In Europe, which accounts for 40% of Rebif® sales (Q1 2013: 41%) and is the second-largest market in terms of Rebif® sales, slipped to € 183 million (Q1 2013: € 184 million) on the back of slight organic growth of 0.2% and negative exchange rate effects of –0.9%.
In the first quarter of 2014, sales of the oncology drug Erbitux® showed slight organic growth of 0.5%. As a result of negative foreign exchange effects of –6.1%, sales decreased overall to € 209 million (Q1 2013: € 222 million). Europe generates 59% (Q1 2013: 60%) of Erbitux® sales, making it the top-selling region for this product. There, Erbitux® sales fell organically by –7.3% to a total of € 123 million, which includes an adverse foreign exchange impact of –0.1% (Q1 2013: € 133 million). Despite organic growth of 6.4%, sales in Emerging Markets declined to € 54 million (Q1 2013: € 59 million) as a result of strong currency headwinds of –13.5%. This region generated an unchanged 26% of total Erbitux® sales. At 23.4%, the Rest of World region achieved the strongest organic growth for this oncology drug, delivering sales of € 32 million (Q1 2013: € 30 million). Erbitux® sales developed well in Japan, where strong organic growth amounted to 38.2% but was partially offset by negative foreign exchange effects. In particular, higher sales of Erbitux® in the treatment of both head and neck cancer as well as metastatic colorectal cancer drove this performance.
| XLS |
|
Merck Serono | Sales and organic growth of Rebif® and Erbitux® by region – Q1 2014 |
||||||
|
|
|
|
|
|
|
|
|
|
|
|
|
|
|
|
|
|
|
Total |
Europe |
North America |
Emerging Markets |
Rest of World |
|
Rebif® |
€ million |
459.3 |
183.1 |
241.8 |
28.1 |
6.2 |
|
|
Organic growth in % |
5.3 |
0.2 |
12.2 |
–6.6 |
–18.1 |
|
|
% of sales |
100 |
40 |
53 |
6 |
1 |
|
Erbitux® |
€ million |
209.2 |
122.9 |
– |
54.4 |
31.9 |
|
|
Organic growth in % |
0.5 |
–7.3 |
– |
6.4 |
23.4 |
|
|
% of sales |
100 |
59 |
– |
26 |
15 |
Sales and the organic growth rates of the key products developed as follows:
Merck Serono | Sales and organic growth of key products – Q1 2014
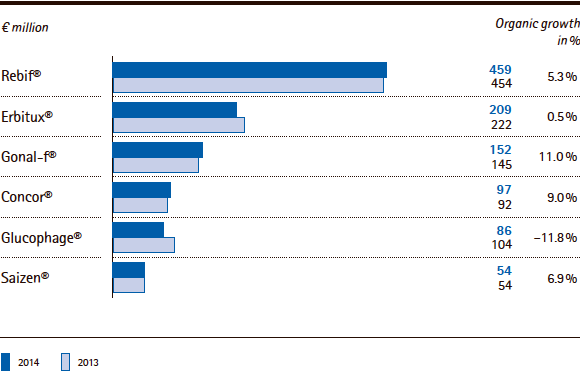
Following a relatively weak year-earlier quarter, Merck Serono achieved strong organic growth of 11.0% with Gonal-f® in the first quarter of 2014. Including adverse currency effects, sales rose by 5.3% to € 152 million (Q1 2013: € 145 million). The strongest increase in Gonal-f® sales was achieved in Europe. Likewise, organic growth rates improved noticeably in the other regions.
Sales by the Endocrinology franchise, which mainly consists of products to treat metabolic and growth disorders, rose organically by 1.6%. Including foreign exchange effects of –5.4%, sales amounted to € 88 million (Q1 2013: € 92 million). Sales of the growth hormone Saizen®, the top-selling product of this franchise, saw an organic increase of 6.9% as well as negative foreign exchange effects of –7.3%. Therefore, at € 54 million, sales remained at the previous year’s level.
The General Medicine franchise (including CardioMetabolic Care), which commercializes Merck Serono’s products to treat cardiovascular diseases and diabetes, among others, generated organic sales growth of 1.7%. Organic sales of products to treat thyroid disorders developed well in the first quarter of 2014. The decline in sales of Glucophage®, which is used to treat diabetes, to € 86 million (Q1 2013: € 104 million) was largely due to the strong year-earlier quarter and with supply difficulties currently being faced in Europe. Including negative exchange rate changes of –6.0%, sales by the General Medicine franchise amounted to € 381 million (Q1 2013: € 397 million).
The division’s results of operations developed as follows:
| XLS |
|
Merck Serono | Results of operations |
|||||
|
|
|
|
|
||
|
|
|
|
|
||
|
€ million |
Q1 – 2014 |
Q1 – 2013* |
Change in % |
||
|
|||||
|
Sales |
1,374.9 |
1,388.8 |
–1.0 |
||
|
Royalty, license and commission income |
46.2 |
93.3 |
–50.4 |
||
|
Total revenues |
1,421.1 |
1,482.1 |
–4.1 |
||
|
|
|
|
|
||
|
Cost of sales |
–254.3 |
–230.2 |
10.5 |
||
|
Gross profit |
1,166.8 |
1,251.9 |
–6.8 |
||
|
|
|
|
|
||
|
Marketing and selling expenses |
–279.8 |
–294.8 |
–5.1 |
||
|
Royalty, license and commission expenses |
–131.7 |
–131.5 |
0.2 |
||
|
Administration expenses |
–52.2 |
–50.2 |
4.0 |
||
|
Other operating expenses and income |
–26.3 |
–127.7 |
–79.4 |
||
|
Research and development costs |
–298.3 |
–322.5 |
–7.5 |
||
|
Amortization of intangible assets |
–142.6 |
–155.0 |
–8.0 |
||
|
Operating result (EBIT) |
235.8 |
170.2 |
38.5 |
||
|
Depreciation / Amortization / Reversals of impairments |
192.1 |
238.1 |
–19.3 |
||
|
(of which: one-time items) |
(1.3) |
(26.6) |
(–95.3) |
||
|
EBITDA |
428.0 |
408.3 |
4.8 |
||
|
Restructuring costs |
9.5 |
28.6 |
–66.8 |
||
|
Integration costs / IT costs |
0.5 |
0.7 |
–27.9 |
||
|
Gains / losses on the divestment of businesses |
– |
– |
– |
||
|
Acquisition costs |
– |
– |
– |
||
|
Other one-time items |
– |
– |
– |
||
|
EBITDA pre one-time items |
438.0 |
437.7 |
0.1 |
||
Taking into account the development of sales and total revenues as well as cost of sales, the gross profit of the Merck Serono division fell by –6.8% or € –85 million to € 1,167 million. This was mainly attributable to lower royalty, license and commission income, as well as the negative impact of exchange rates on sales. Strict cost control led to lower marketing and selling expenses for the division. Among other things, the decline in other operating expenses (net) was driven by the development of one-time items (including impairment losses), which dropped from € –56 million in the year-earlier quarter to € –11 million in the first quarter of 2014. This mainly related to one-time items in connection with the “Fit for 2018” transformation and growth program. Furthermore, lower litigation expenses as well as income from the measurement of trade accounts receivable had a positive effect on the net amount of other operating expenses and income. Research and development costs in the year-earlier quarter reflected higher costs of clinical development as well as one-time expenses. Consequently, the research spending ratio decreased to 21.7% in the first quarter of 2014 (Q1 2013: 23.2%). Lower amortization of intangible assets was related to the expiration of the amortization period for the intangible asset Avonex®, which was acquired within the scope of the Serono acquisition. After eliminating depreciation and amortization, and adjusting for one-time items, EBITDA pre one-time items amounted to € 438 million, which was on par with the previous year. As a result, the EBITDA margin pre one-time items rose slightly to 31.9% (Q1 2013: 31.5%) despite the impact of negative currency effects on sales as well as lower royalty and license income.
Development of business free cash flow
In the first quarter of 2014, business free cash flow of the Merck Serono division increased sharply by € 140 million to € 480 million (Q1 2013: € 340 million). Whereas the development of EBITDA pre one-time items, capital spending as well as inventories only had a minor overall effect on business free cash flow, the reduction of trade accounts receivable in the first quarter of 2014 fueled the improvement of business free cash flow.
| XLS |
|
Merck Serono | Business free cash flow |
|||||
|
|
|
|
|
||
|
|
|
|
|
||
|
€ million |
Q1 – 2014 |
Q1 – 2013* |
Change in % |
||
|
|||||
|
EBITDA pre one-time items |
438.0 |
437.7 |
0.1 |
||
|
Investments in property, plant and equipment, software as well as advance payments for intangible assets |
–26.1 |
–18.5 |
41.0 |
||
|
Changes in inventories |
–6.9 |
–15.8 |
–56.3 |
||
|
Changes in trade accounts receivable |
75.0 |
–63.4 |
– |
||
|
Business free cash flow |
480.0 |
340.0 |
41.2 |
||
 back
back
