

 4
4
| XLS |
|
Performance Materials | Key figures |
||||||
|
|
|
|
|
|
|
|
|
|
|
|
|
|
|
|
|
€ million |
Q2 – 2014 |
Q2 – 2013 |
Change in % |
Jan.–June 2014 |
Jan.–June 2013 |
Change in % |
|
Total revenues |
505.9 |
431.8 |
17.2 |
908.6 |
853.9 |
6.4 |
|
Sales |
505.7 |
431.1 |
17.3 |
907.9 |
852.4 |
6.5 |
|
Operating result (EBIT) |
137.5 |
170.1 |
–19.2 |
289.2 |
342.7 |
–15.6 |
|
Margin (% of sales) |
27.2 |
39.5 |
|
31.8 |
40.2 |
|
|
EBITDA |
178.1 |
205.1 |
–13.2 |
356.9 |
408.4 |
–12.6 |
|
Margin (% of sales) |
35.2 |
47.6 |
|
39.3 |
47.9 |
|
|
EBITDA pre one-time items |
226.3 |
208.9 |
8.3 |
412.8 |
416.3 |
–0.9 |
|
Margin (% of sales) |
44.8 |
48.5 |
|
45.5 |
48.8 |
|
|
Business free cash flow |
179.4 |
201.9 |
–11.1 |
344.9 |
400.9 |
–14.0 |
Development of sales and results of operations
In the second quarter of 2014, sales of the Performance Materials division grew by 17.3% to € 506 million (Q2 2013: € 431 million). Both organic growth of 1.8% as well as acquisition-related sales increases of 20.5% or € 89 million contributed to this rise. Negative foreign exchange effects of –5.1% stemming mainly from the Taiwan dollar and the U.S. dollar again lowered divisional sales in the second quarter of 2014. Organic growth was delivered by the already existing Liquid Crystals, Pigments & Cosmetics and Advanced Technologies business units. The acquisition-related sales growth was due to the first-time consolidation of AZ Electronic Materials as of May 2, 2014. During the integration phase, the acquired business will be managed as an independent business unit in addition to those units already in place.
The Liquid Crystals business unit again maintained its market leadership position in liquid crystal materials in the second quarter of 2014. Overall, the two leading technologies, i.e. PS-VA and IPS, saw good organic growth thanks to continued demand for displays, however this was outweighed by negative exchange rate effects. As a result, the high year-earlier sales, which were driven by strong demand in China, among other things, could not be fully reached on a nominal basis.
The Pigments & Cosmetics business unit posted slight organic sales growth in the second quarter of 2014. Xirallic® pigments, which are primarily used in automotive coatings, as well as functional materials were the main drivers. Since negative foreign exchange effects could not be fully compensated for by organic growth, the business unit’s sales declined slightly. Thanks to higher demand for OLED displays, the Advanced Technologies business unit made a visible contribution to organic growth.
Performance Materials | Sales by region – Q2 2014
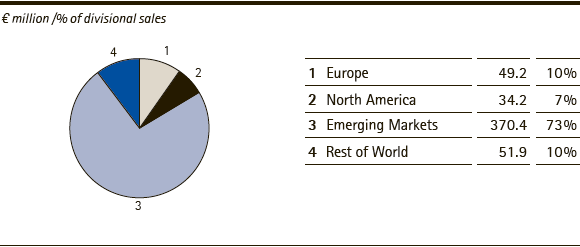
Accounting for 73% of sales (Q2 2013: 75%), the Emerging Markets region generated the vast majority of the division’s sales. This is due to the concentration of customers for liquid crystals as well as high-tech materials from the new AZ business unit in Asia. Despite a high year-earlier basis, the already existing business units achieved soft organic sales growth of 2.3%. Sales in the Emerging Markets region rose by 17.8% due to acquisitions, in other words the takeover of AZ. Taking negative foreign exchange effects of –5.3% into account, sales in this region rose to € 370 million (Q2: 2013: € 323 million).
In the second quarter of 2014, the division posted sales of € 49 million (Q2 2013: € 42 million) in Europe. As a result, Europe’s share of sales remained unchanged at 10%. The Pigments & Cosmetics business unit generated organic growth of 1.1%, which was due, among other things, to the demand for Xirallic® pigments. Sales in Europe rose 15.2% owing to the first-time consolidation of AZ.
The Rest of World region, which is dominated by Japan, recorded organic sales growth of 1.8%. The acquisition-related increase from the purchase of AZ was 26.9%. Amid currency headwinds of –8.9%, this resulted in sales of € 52 million (Q2 2013: € 43 million). The share of sales attributable to the Rest of World region thus remained unchanged at 10%.
In North America, sales grew by 48.6% to € 34 million (Q2 2013: € 23 million). This was driven by the acquisition-related sales increase of 56.5%, which was partly offset by an organic sales decline of –3.6% as well as negative exchange rate effects of –4.3%. Consequently, the region contributed 7% to divisional sales in the second quarter of 2014 (Q2 2013: 5%).
| XLS |
|
Performance Materials | Sales components by region – Q2 2014 |
|||||
|
|
|
|
|
|
|
|
|
|
|
|
|
|
|
€ million |
Sales |
Organic growth |
Exchange rate effects |
Acquisitions/ divestments |
Total change |
|
Europe |
49.2 |
1.1 |
0.1 |
15.2 |
16.4 |
|
North America |
34.2 |
–3.6 |
–4.3 |
56.5 |
48.6 |
|
Emerging Markets |
370.4 |
2.3 |
–5.3 |
17.8 |
14.8 |
|
Rest of World |
51.9 |
1.8 |
–8.9 |
26.9 |
19.8 |
|
Performance Materials |
505.7 |
1.8 |
–5.1 |
20.5 |
17.3 |
In the first half of 2014, sales of the Performance Materials division increased 6.5% to € 908 million (January-June 2013: € 852 million. This was attributable to organic growth of 1.5% as well as to an acquisition-related increase of 10.4%. By contrast, a negative foreign exchange impact of –5.4% lowered divisional sales. Sales volumes of liquid crystals developed well in the first half of 2014 thanks to continued strong demand from display manufacturers, making it possible to achieve soft organic growth. However, taking into account negative exchange rate effects, the Liquid Crystals business unit could not maintain its high year-earlier sales. The development of sales in the Pigments & Cosmetics business unit was also impacted by negative exchange rate effects in the first half of 2014. Both decorative pigments and functional materials saw slight organic sales growth, yet this could not compensate for the adverse foreign exchange impact. Including the sales of AZ, which totaled € 89 million for the period from May to June 2014, divisional sales rose by a total of 6.5% in the first half of 2014.
The results of operations developed as follows:
| XLS |
|
Performance Materials | Results of operations |
||||||
|
|
|
|
|
|
|
|
|
|
|
|
|
|
|
|
|
€ million |
Q2 – 2014 |
Q2 – 2013 |
Change in % |
Jan.–June 2014 |
Jan.–June 2013 |
Change in % |
|
Sales |
505.7 |
431.1 |
17.3 |
907.9 |
852.4 |
6.5 |
|
Royalty, license and commission income |
0.2 |
0.6 |
–65.0 |
0.7 |
1.4 |
–49.8 |
|
Total revenues |
505.9 |
431.8 |
17.2 |
908.6 |
853.9 |
6.4 |
|
|
|
|
|
|
|
|
|
Cost of sales |
–245.0 |
–160.3 |
52.9 |
–401.8 |
–316.5 |
26.9 |
|
Gross profit |
260.9 |
271.5 |
–3.9 |
506.9 |
537.3 |
–5.7 |
|
|
|
|
|
|
|
|
|
Marketing and selling expenses |
–45.0 |
–37.0 |
21.8 |
–77.6 |
–72.4 |
7.2 |
|
Royalty, license and commission expenses |
–0.9 |
–0.4 |
149.2 |
–1.7 |
–0.8 |
105.6 |
|
Administration expenses |
–14.7 |
–7.8 |
88.8 |
–22.5 |
–14.8 |
52.0 |
|
Other operating expenses and income |
–20.2 |
–19.2 |
5.3 |
–32.9 |
–29.7 |
10.5 |
|
Research and development costs |
–37.9 |
–33.4 |
13.3 |
–74.9 |
–69.8 |
7.3 |
|
Amortization of intangible assets |
–4.6 |
–3.6 |
28.9 |
–8.2 |
–7.1 |
15.7 |
|
Operating result (EBIT) |
137.5 |
170.1 |
–19.2 |
289.2 |
342.7 |
–15.6 |
|
Depreciation / Amortization / Reversals of impairments |
40.6 |
35.0 |
16.0 |
67.7 |
65.8 |
3.0 |
|
(of which: one-time items) |
– |
(0.7) |
– |
– |
(0.7) |
– |
|
EBITDA |
178.1 |
205.1 |
–13.2 |
356.9 |
408.4 |
–12.6 |
|
Restructuring costs |
1.5 |
3.2 |
–52.5 |
3.3 |
6.8 |
–50.8 |
|
Integration costs / IT costs |
1.1 |
0.6 |
73.8 |
1.5 |
1.1 |
32.2 |
|
Gains / losses on the divestment of businesses |
– |
– |
– |
4.4 |
– |
– |
|
Acquisition costs |
45.7 |
– |
– |
46.7 |
– |
– |
|
Other one-time items |
– |
– |
– |
– |
– |
– |
|
EBITDA pre one-time items |
226.3 |
208.9 |
8.3 |
412.8 |
416.3 |
–0.9 |
The development of the results of operations was significantly influenced by the consolidation of AZ since May 2, 2014. In particular, the sharp increase in cost of sales in the second quarter of 2014 related mainly to the first-time consolidation of AZ. The AZ inventories from the acquisition were stepped up to fair values on the date of first-time consolidation. For the period from May 2, 2014 to June 30, 2014, € 30 million of this step-up was included as an expense in cost of sales. As a consequence of this one-time expense, the consolidated contribution of AZ to gross profit in the second quarter was negligible. The gross margin of Performance Materials fell accordingly to 51.6% (Q2 2013: 63.0%). The decline in the operating result (EBIT) as well as EBITDA to € 137 million and € 178 million, respectively, was due among other things to the described consequences of the AZ inventory revaluation, which were recognized as an expense. During the determination of EBITDA pre one-time items, this one-time effect from the inventory revaluation was eliminated. Therefore this key performance indicator rose by 8.3% to € 226 million and includes the adjusted amount from AZ. The EBITDA margin pre one-time items fell to 44.8% (Q2 2013: 48.5%).
In the first half of 2014, EBITDA pre one-time items declined slightly by –0.9% to € 413 million. Expressed as a percentage of sales, this resulted in an EBITDA margin pre one-time items of 45.5% (January-June 2013: 48.8%).
Development of business free cash flow
In the second quarter of 2014, the Performance Materials division generated business free cash flow of € 179 million (Q2 2013: € 202 million). The sharp increase in inventories and trade accounts receivable was related to the acquisition of AZ. This effect was offset by the adjustment amounting to € 164 million. Overall, AZ has made a positive contribution to business free cash flow since the first-time consolidation. The decrease in this key performance indicator to € 179 million was attributable to the development of the balance sheet items of the other business units.
| XLS |
|
Performance Materials | Business free cash flow |
||||||
|
|
|
|
|
|
|
|
|
|
|
|
|
|
|
|
|
€ million |
Q2 – 2014 |
Q2 – 2013 |
Change in % |
Jan.–June 2014 |
Jan.–June 2013 |
Change in % |
|
EBITDA pre one-time items |
226.3 |
208.9 |
8.3 |
412.8 |
416.3 |
–0.9 |
|
Investments in property, plant and equipment, software as well as advance payments for intangible assets |
–18.9 |
–12.9 |
46.4 |
–30.8 |
–22.7 |
36.0 |
|
Changes in inventories |
–96.6 |
10.9 |
– |
–89.6 |
18.2 |
– |
|
Changes in trade accounts receivable |
–95.8 |
–4.9 |
– |
–111.8 |
–10.9 |
– |
|
Adjustments first-time consolidation of AZ Electronic Materials |
164.4 |
– |
– |
164.4 |
– |
– |
|
Business free cash flow |
179.4 |
201.9 |
–11.1 |
344.9 |
400.9 |
–14.0 |
In the first half of 2014, business free cash flow was € 345 million (January-June 2013: € 401 million), equivalent to a decline of € –56 million.
