|
Key figures for 2010 |
|||||
|
|
|
|
|
|
|
|
EUR million |
Pharmaceuticals |
Chemicals |
Corporate and Other |
Total |
Change in % |
|
Total revenues |
6,225.5 |
3,065.1 |
– |
9,290.6 |
19.9 |
|
Gross margin |
5,109.7 |
1,795.5 |
– |
6,905.2 |
20.8 |
|
Research and development |
1,192.0 |
205.1 |
– |
1,397.1 |
3.9 |
|
Operating result |
579.0 |
624.0 |
–89.5 |
1,113.5 |
71.6 |
|
Exceptional items |
68.6 |
–1.0 |
–68.4 |
–0.8 |
–97.3 |
|
Earnings before interest and tax (EBIT) |
647.6 |
623.0 |
–157.9 |
1,112.7 |
79.2 |
|
EBIT before depreciation and amortization (EBITDA) |
1,603.7 |
1,007.5 |
–154.3 |
2,456.9 |
51.2 |
|
Return on sales in % (ROS: operating result/total revenues) |
9.3 |
20.4 |
– |
12.0 |
|
|
Free cash flow |
1,343.6 |
–4,129.7 |
–736.4 |
–3,522.5 |
– |
|
Underlying free cash flow |
1,353.3 |
812.2 |
–495.7 |
1,669.8 |
96.1 |
Total revenues by business sector*EUR million 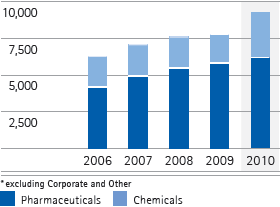 |
Operating result by business sectorEUR million 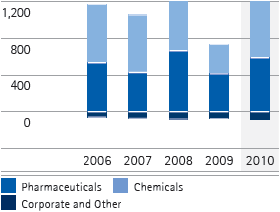 |