

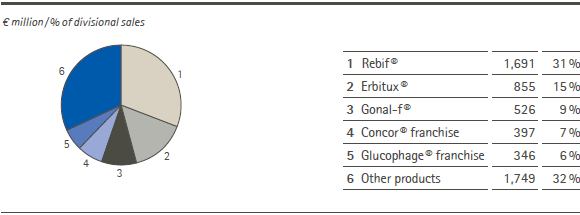
The Merck Serono division increased total revenues by 2.9% to € 5,920 million in 2011. Sales rose nominally by 2.9% as well, with foreign exchange rates and divestments exerting a negative impact. Organic growth amounted to 5.1%. The classic branded products from the Glucophage® and Concor® franchises as well as our thyroid products were responsible for more than half of the sales growth driven by emerging markets. Our five top-selling biopharmaceuticals – Rebif®, Erbitux®, Gonal-f®, Saizen®, and Serostim® – generated 60% of sales. Rebif®, our drug to treat relapsing multiple sclerosis, was once again our leading product with sales of € 1,691 million (+1.4%). Erbitux®, our targeted cancer therapy, achieved sales of € 855 million (+4.3%).
Our five top-selling drugs by sales in 2011
At € 356 million, royalty, license and commission income was higher than in 2010. Gross margin increased slightly to € 4,888 million (+2.0%). Research and development expenses increased by 5.0% to € 1,225 million. The operating result declined by 46% to € 304 million owing to one-time write-downs totaling € 322 million and additional one-time expenses. The largest single effect was the asset impairment of our biotech production plant in Corsier-sur-Vevey (Switzerland) amounting to € 165 million owing to overcapacity. Exceptional items amounted to € 25 million mainly due to a gain of € 19 million in connection with the divestment of Théramex to Teva in 2010. This gain relates to milestone payments for the transfer of distribution rights to Théramex products in a number of countries, including Spain and Brazil. Return on sales (ROS) declined to 5.1%; underlying free cash flow decreased by 7.8% to € 1,205 million.
| XLS |
|
Merck Serono | Key figures |
| ||
|
|
|
|
|
|
|
|
|
|
|
€ million |
2011 |
2010 |
Δ in % |
|
Total revenues |
5,920 |
5,754 |
2.9 |
|
Gross margin |
4,888 |
4,793 |
2.0 |
|
R&D |
1,225 |
1,167 |
5.0 |
|
Operating result |
304 |
565 |
–46 |
|
Exceptional items |
25 |
69 |
–63 |
|
Free cash flow |
1,475 |
1,298 |
14 |
|
Underlying free cash flow |
1,205 |
1,308 |
–7.8 |
|
ROS in % |
5.1 |
9.8 |
|
 back
back
