

| XLS |
|
Consumer Health | Key figures |
||||||||
|
|
|
|
|
|
|
|
||
|
|
|
|
|
|
|
|
||
|
€ million |
Q2 – 2014 |
Q2 – 20131 |
Change in % |
Jan.–June 2014 |
Jan.–June 20131 |
Change in % |
||
|
||||||||
|
Total revenues |
185.0 |
180.1 |
2.7 |
365.6 |
361.9 |
1.0 |
||
|
Sales |
184.7 |
178.9 |
3.3 |
364.9 |
360.6 |
1.2 |
||
|
Operating result (EBIT) |
36.9 |
34.2 |
7.9 |
73.7 |
71.0 |
3.8 |
||
|
Margin (% of sales) |
20.0 |
19.1 |
|
20.2 |
19.7 |
|
||
|
EBITDA |
39.3 |
36.5 |
7.6 |
78.4 |
76.0 |
3.3 |
||
|
Margin (% of sales) |
21.3 |
20.4 |
|
21.5 |
21.1 |
|
||
|
EBITDA pre one-time items |
41.4 |
35.5 |
16.7 |
82.6 |
74.8 |
10.5 |
||
|
Margin (% of sales) |
22.4 |
19.8 |
|
22.6 |
20.7 |
|
||
|
Business free cash flow |
36.2 |
50.9 |
–28.9 |
52.4 |
71.8 |
–27.0 |
||
Development of sales and results of operations
In the second quarter of 2014, the Consumer Health division delivered healthy organic sales growth of 8.5%. Including negative currency effects of –5.2%, divisional sales rose by a total of 3.3% to € 185 million (Q2 2013: € 179 million). Organic sales growth was mainly driven by the strategic brands Neurobion®, Floratil® and Femibion®, as well as by local brands in Germany.
Consumer Health | Sales by region – Q2 2014
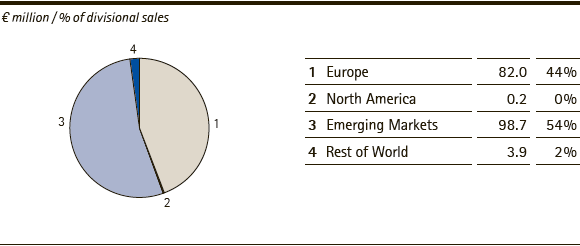
From a geographic perspective, the division’s key regions, namely Europe and Emerging Markets, delivered good organic growth rates. The Emerging Markets region, which accounts for 54% of sales (Q2 2013: 53%) and is thus the division’s largest region, generated strong organic sales growth of 14.2%. Including negative exchange rate effects of –9.9%, sales amounted to € 99 million (Q2: 2013: € 95 million). In particular, the strategic brands Neurobion® and Floratil® were the main growth drivers. Sales of these two strategic brands benefited particularly in Brazil from the focus on consumer-oriented marketing activities.
In Europe, the Consumer Health division posted an organic growth rate of 3.8% as well as slightly positive foreign exchange effects of 0.5%, which led to an increase in sales to € 82 million (Q2 2013: € 79 million). As in the first quarter of 2014, weaker demand for Bion® and Nasivin® was compensated for in the second quarter of 2014 by strong sales volumes of the vitamin supplement Femibion® and local brands in Germany as well as Apaisyl®, a local French brand of insect repellant and skin care products. The share of the divisional sales accounted for by Europe remained constant at 44%.
| XLS |
|
Consumer Health | Sales components by region – Q2 2014 |
|||||
|
|
|
|
|
|
|
|
|
|
|
|
|
|
|
€ million |
Sales |
Organic growth |
Exchange rate effects |
Acquisitions/ divestments |
Total change |
|
Europe |
82.0 |
3.8 |
0.5 |
– |
4.3 |
|
North America |
0.2 |
–15.8 |
3.1 |
– |
–12.7 |
|
Emerging Markets |
98.7 |
14.2 |
–9.9 |
– |
4.3 |
|
Rest of World |
3.9 |
–22.1 |
–6.7 |
– |
–28.8 |
|
Consumer Health |
184.7 |
8.5 |
–5.2 |
– |
3.3 |
In the first half of 2014, the Consumer Health division increased its sales slightly by 1.2% to € 365 million (January-June 2013: € 361 million). This was attributable to organic sales growth of 7.1% along with a negative foreign exchange impact of –5.8%. The division’s two most important regions, Emerging Markets and Europe, both delivered organic sales increases; the growth rates were 9.7% and 5.5%, respectively. In particular, demand for the products sold under the strategic brands Neurobion® and Floratil® as well as for local brands drove organic sales growth in both regions. In Europe, the organic increase in sales of Femibion® offset weaker demand for Bion®.
The development of results of operations is presented in the following table:
| XLS |
|
Consumer Health | Results of operations |
||||||||
|
|
|
|
|
|
|
|
||
|
|
|
|
|
|
|
|
||
|
€ million |
Q2 – 2014 |
Q2 – 20131 |
Change in % |
Jan.–June 2014 |
Jan.–June 20131 |
Change in % |
||
|
||||||||
|
Sales |
184.7 |
178.9 |
3.3 |
364.9 |
360.6 |
1.2 |
||
|
Royalty, license and commission income |
0.3 |
1.2 |
–74.4 |
0.6 |
1.3 |
–53.3 |
||
|
Total revenues |
185.0 |
180.1 |
2.7 |
365.6 |
361.9 |
1.0 |
||
|
|
|
|
|
|
|
|
||
|
Cost of sales |
–59.7 |
–62.4 |
–4.4 |
–119.3 |
–119.3 |
– |
||
|
Gross profit |
125.4 |
117.7 |
6.6 |
246.3 |
242.6 |
1.5 |
||
|
|
|
|
|
|
|
|
||
|
Marketing and selling expenses |
–70.0 |
–72.3 |
–3.1 |
–138.1 |
–141.4 |
–2.3 |
||
|
Royalty, license and commission expenses |
–1.0 |
–0.4 |
189.5 |
–0.8 |
–1.1 |
–28.1 |
||
|
Administration expenses |
–6.6 |
–6.3 |
3.5 |
–12.8 |
–12.1 |
5.9 |
||
|
Other operating expenses and income |
–5.3 |
2.0 |
– |
–9.9 |
–4.2 |
135.8 |
||
|
Research and development costs |
–4.8 |
–5.9 |
–17.4 |
–9.7 |
–11.6 |
–16.7 |
||
|
Amortization of intangible assets |
–0.7 |
–0.6 |
16.5 |
–1.4 |
–1.2 |
16.5 |
||
|
Operating result (EBIT) |
36.9 |
34.2 |
7.9 |
73.7 |
71.0 |
3.8 |
||
|
Depreciation / Amortization / Reversals of impairments |
2.4 |
2.3 |
4.0 |
4.8 |
5.0 |
–4.1 |
||
|
(of which: one-time items) |
– |
– |
– |
– |
– |
– |
||
|
EBITDA |
39.3 |
36.5 |
7.6 |
78.4 |
76.0 |
3.3 |
||
|
Restructuring costs |
2.0 |
–1.1 |
– |
4.2 |
–1.2 |
– |
||
|
Integration costs / IT costs |
– |
– |
– |
– |
– |
– |
||
|
Gains / losses on the divestment of businesses |
– |
– |
– |
– |
– |
– |
||
|
Acquisition costs |
– |
– |
– |
– |
– |
– |
||
|
Other one-time items |
– |
– |
– |
– |
– |
– |
||
|
EBITDA pre one-time items |
41.4 |
35.5 |
16.7 |
82.6 |
74.8 |
10.5 |
||
In the second quarter of 2014, the division’s gross profit rose by 6.6% to € 125 million since cost of sales fell despite higher sales. Consequently, the gross margin grew to 67.9% (Q2 2013: 65.8%). The change in other operating expenses and income from € 2 million in the year-earlier quarter to €-5 million in the second quarter of 2014 was largely due to one-time items in connection with restructuring measures. Moreover, impairments on receivables increased by around € 2 million second quarter of 2014. This amount was also reported under other operating expenses. Adjusted for one-time effects from restructuring measures, EBITDA pre one-time items surged by 16.7% to € 41 million. The resulting improvement in the EBITDA margin pre one-time items by 2.6 percentage points to 22.4% (Q2 2013: 19.8%) reflects the positive development of the business, which was made possible especially by the focus on profitable strategic brands.
In the first half of 2014, the division generated EBITDA pre one-time items of € 83 million, representing an increase of 10.5% compared with the year-earlier period. The resulting EBITDA pre margin increased to 22.6% (January-June 2013: 20.7%).
Development of business free cash flow
In the second quarter of 2014, business free cash flow of the Consumer Health division declined by approximately € –15 million to € 36 million. This decrease was mainly the result of higher receivables in the second quarter of 2014 in comparison with the reduction in trade accounts receivable achieved in the year-earlier quarter. The increase in EBITDA pre one-time items and the slight decline in inventories in the second quarter of 2014 compensated for this development to some extent.
| XLS |
|
Consumer Health | Business free cash flow |
||||||||
|
|
|
|
|
|
|
|
||
|
|
|
|
|
|
|
|
||
|
€ million |
Q2 – 2014 |
Q2 – 20131 |
Change in % |
Jan.–June 2014 |
Jan.–June 20131 |
Change in % |
||
|
||||||||
|
EBITDA pre one-time items |
41.4 |
35.5 |
16.7 |
82.6 |
74.8 |
10.5 |
||
|
Investments in property, plant and equipment, software as well as advance payments for intangible assets |
–1.4 |
–0.8 |
65.0 |
–3.1 |
–1.4 |
116.0 |
||
|
Changes in inventories |
3.3 |
1.1 |
188.1 |
–6.8 |
– |
– |
||
|
Changes in trade accounts receivable |
–7.0 |
15.2 |
–146.4 |
–20.4 |
–1.6 |
– |
||
|
Business free cash flow |
36.2 |
50.9 |
–28.9 |
52.4 |
71.8 |
–27.0 |
||
In the first half of 2014, business free cash flow declined by –27.0% or € –19 million to € 52 million (January-June 2013: € 72 million).
 back
back
