

| XLS |
|
Merck Millipore | Key figures |
||||||
|
|
|
|
|
|
|
|
|
|
|
|
|
|
|
|
|
€ million |
Q2 – 2014 |
Q2 – 2013 |
Change in % |
Jan.–June 2014 |
Jan.–June 2013 |
Change in % |
|
Total revenues |
661.5 |
668.7 |
–1.1 |
1,321.9 |
1,343.3 |
–1.6 |
|
Sales |
658.7 |
666.3 |
–1.1 |
1,315.2 |
1,335.0 |
–1.5 |
|
Operating result (EBIT) |
75.2 |
72.4 |
3.8 |
162.2 |
144.8 |
12.1 |
|
Margin (% of sales) |
11.4 |
10.9 |
|
12.3 |
10.8 |
|
|
EBITDA |
150.3 |
148.2 |
1.4 |
314.0 |
299.7 |
4.8 |
|
Margin (% of sales) |
22.8 |
22.2 |
|
23.9 |
22.5 |
|
|
EBITDA pre one-time items |
165.7 |
155.9 |
6.3 |
335.4 |
317.8 |
5.5 |
|
Margin (% of sales) |
25.2 |
23.4 |
|
25.5 |
23.8 |
|
|
Business free cash flow |
125.5 |
156.6 |
–19.9 |
179.9 |
237.7 |
–24.3 |
Development of sales and results of operations
Despite a challenging market environment characterized by increasing competitive pressure, the Merck Millipore division generated solid organic sales growth of 4.0% in the second quarter of 2014. This achievement was mainly driven by the excellent business performance of the Process Solutions business area. The organic increase was countered by a negative foreign exchange impact of –4.2%, which largely stemmed from the U.S. dollar and the Japanese yen. Additionally, Merck Millipore’s sales declined by –0.9% in comparison with the year-earlier quarter owing to the divestment of the Discovery and Development Solutions business field as of March 31, 2014. Including these effects, divisional sales decreased overall by –1.1% to € 659 million (Q2 2013: € 666 million).
Merck Millipore | Sales by region – Q2 2014
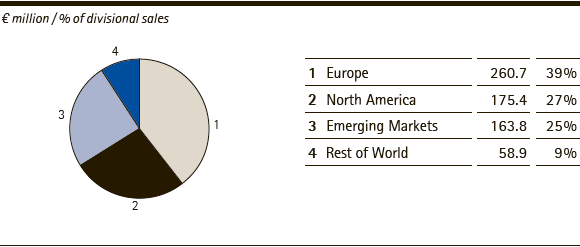
In the second quarter of 2014, Merck Millipore achieved organic sales growth in all regions. Accounting for an unchanged 39% of divisional sales, Europe remained the division’s largest geographic market, delivering organic growth of 1.4% and sales of € 261 million (Q2 2013: € 258 million). Process Solutions posted strong organic growth in Europe, which enabled it to compensate for the weaker performance of the other business areas in the region.
In North America, the division generated slight organic sales growth of 1.1%. Currency effects lowered sales by –4.4%, mainly as a result of the weaker U.S. dollar. Overall, the division’s sales in North America decreased to € 175 million (Q2 2013: € 185 million), which represented a share of 27% (Q2 2013: 28%) of Merck Millipore’s sales in the second quarter of 2014. The slight organic sales increase in North America was attributable to the Bioscience and Process Solutions business areas, which posted growth rates of 2.5% and 1.4%, respectively.
Sales developed very positively in the Emerging Markets region, which delivered organic sales growth of 13.0%. Despite currency headwinds of –9.7% and divestment-related declines of –0.2%, sales rose to € 164 million (Q2 2013: € 159 million). The strong organic sales performance was fueled by good demand for products from all the division’s business areas. The Process Solutions business area, in particular, achieved high organic growth. The share of divisional sales generated by the Emerging Markets region therefore increased by one percentage point to 25%.
As a result of significant currency headwinds of –7.9%, especially relative to the Japanese yen, sales in the Rest of World region declined to € 59 million (Q2 2013: € 64 million). Consequently, this region’s share of overall divisional sales decreased to 9% (Q2 2013: 10%).
| XLS |
|
Merck Millipore | Sales components by region – Q2 2014 |
|||||
|
|
|
|
|
|
|
|
|
|
|
|
|
|
|
€ million |
Sales |
Organic growth |
Exchange rate effects |
Acquisitions/ divestments |
Total change |
|
Europe |
260.7 |
1.4 |
0.1 |
–0.5 |
1.0 |
|
North America |
175.4 |
1.1 |
–4.4 |
–2.1 |
–5.4 |
|
Emerging Markets |
163.8 |
13.0 |
–9.7 |
–0.2 |
3.1 |
|
Rest of World |
58.9 |
0.4 |
–7.9 |
–0.6 |
–8.0 |
|
Merck Millipore |
658.7 |
4.0 |
–4.2 |
–0.9 |
–1.1 |
All business areas contributed to organic growth in the second quarter of 2014. The Process Solutions business area, which markets products and services for the pharmaceutical production value chain, among other things, generated organic sales growth of 8.3%, which was the highest rate within the Merck Millipore division. Taking negative foreign exchange effects of –3.7% and divestment-related declines into account, sales amounted to € 290 million (Q2 2013: € 283 million). The share of divisional sales generated by Process Solutions thus rose to 44% (Q2 2013: 42%). This increase was driven by higher demand from the pharmaceutical industry for products used in biopharmaceutical manufacturing, especially filtration systems and single-use solutions.
Lab Solutions, which accounted for a share of 41% (Q2 2013: 42%) of divisional sales, generated organic sales growth of 0.4% with its broad range of products for researchers and scientific laboratories. Taking currency headwinds of –5.0% into account, sales amounted to € 267 million (Q2: 2013: € 279 million).
The Bioscience business area, which primarily markets products and services for academic and pharmaceutical research laboratories, recorded an organic sales increase of 2.0%. Including adverse foreign exchange effects of –3.6%, sales were € 102 million (Q2 2013: € 104 million). Here, across-the-board health care spending cuts in the United States continued to soften demand. However, this was compensated for also by higher demand from diagnostic laboratories for cell analysis products. In the second quarter of 2014, Bioscience accounted for a 15% share of divisional sales (Q2 2013: 16%).
| XLS |
|
Merck Millipore | Sales components by business area – Q2 2014 |
|||||
|
|
|
|
|
|
|
|
|
|
|
|
|
|
|
€ million |
Sales |
Organic growth |
Exchange rate effects |
Acquisitions/ divestments |
Total change |
|
Bioscience |
101.8 |
2.0 |
–3.6 |
– |
–1.7 |
|
Lab Solutions |
266.6 |
0.4 |
–5.0 |
– |
–4.6 |
|
Process Solutions |
290.3 |
8.3 |
–3.7 |
–2.1 |
2.5 |
In the first half of 2014, the division’s sales declined by –1.5% to € 1,315 million (January-June 2013: € 1,335 million). Negative foreign exchange effects of –4.9% were mainly responsible for this decrease. The division delivered organic sales growth of 3.8%. The Process Solutions and Lab Solutions business areas both contributed, generating organic growth of 7.4% and 1.6%, respectively. The divestment of the Discovery and Development Solutions business field impacted sales by –0.4% in the first half of 2014.
The results of operations of the Merck Millipore division developed as follows:
| XLS |
|
Merck Millipore | Results of operations |
||||||
|
|
|
|
|
|
|
|
|
|
|
|
|
|
|
|
|
€ million |
Q2 – 2014 |
Q2 – 2013 |
Change in % |
Jan.–June 2014 |
Jan.–June 2013 |
Change in % |
|
Sales |
658.7 |
666.3 |
–1.1 |
1,315.2 |
1,335.0 |
–1.5 |
|
Royalty, license and commission income |
2.8 |
2.4 |
14.7 |
6.7 |
8.3 |
–19.0 |
|
Total revenues |
661.5 |
668.7 |
–1.1 |
1,321.9 |
1,343.3 |
–1.6 |
|
|
|
|
|
|
|
|
|
Cost of sales |
–274.1 |
–285.9 |
–4.1 |
–538.8 |
–565.6 |
–4.7 |
|
Gross profit |
387.4 |
382.8 |
1.2 |
783.1 |
777.7 |
0.7 |
|
|
|
|
|
|
|
|
|
Marketing and selling expenses |
–164.2 |
–173.6 |
–5.4 |
–332.8 |
343.1 |
–3.0 |
|
Royalty, license and commission expenses |
–3.4 |
–4.2 |
–19.1 |
–7.5 |
–7.9 |
–4.5 |
|
Administration expenses |
–25.8 |
–22.9 |
12.6 |
–54.4 |
–49.7 |
9.4 |
|
Other operating expenses and income |
–30.3 |
–19.6 |
54.4 |
–50.1 |
–50.4 |
–0.7 |
|
Research and development costs |
–39.3 |
–39.6 |
–0.8 |
–77.7 |
–81.0 |
–4.1 |
|
Amortization of intangible assets |
–49.3 |
–50.5 |
–2.4 |
–98.5 |
–100.9 |
–2.4 |
|
Operating result (EBIT) |
75.2 |
72.4 |
3.8 |
162.2 |
144.8 |
12.1 |
|
Depreciation / Amortization / Reversals of impairments |
75.1 |
75.8 |
–0.9 |
151.8 |
155.0 |
–2.0 |
|
(of which: one-time items) |
– |
– |
– |
– |
– |
– |
|
EBITDA |
150.3 |
148.2 |
1.4 |
314.0 |
299.7 |
4.8 |
|
Restructuring costs |
6.7 |
2.6 |
151.8 |
5.4 |
8.6 |
–37.3 |
|
Integration costs / IT costs |
8.7 |
5.0 |
73.2 |
16.2 |
8.5 |
90.0 |
|
Gains / losses on the divestment of businesses |
– |
– |
– |
–0.2 |
– |
– |
|
Acquisition costs |
– |
– |
– |
– |
– |
– |
|
Other one-time items |
– |
– |
– |
– |
1.0 |
– |
|
EBITDA pre one-time items |
165.7 |
155.9 |
6.3 |
335.4 |
317.8 |
5.5 |
Despite the negative impact of the strong euro on sales, gross profit rose slightly by 1.2% to € 387 million in the second quarter of 2014. This resulted in an increase in the gross margin by slightly more than one percentage point from 58.8% (Q2 2013: 57.5%). In comparison with the year-earlier quarter, the operating result (EBIT) of Merck Millipore rose by 3.8% to € 75 million despite the increase in one-time items to € –15 million (Q2 2013: € –8 million). After eliminating depreciation and amortization, and adjusted for one-time items, EBITDA pre, the most important performance indicator, climbed 6.3% to € 166 million amid unfavorable exchange rate developments. Consequently, the EBITDA pre margin rose in the second quarter of 2014 by 1.8 percentage points to 25.2% (Q2 2014: 23.4%). This increase was especially due to the good price and volume development as well as ongoing cost control.
In the first half of 2014, EBITDA pre one-time items of the Merck Millipore division rose by € 18 million, or 5.5%, to € 335 million, reflecting the stable development of the operating business. In comparison with the year-earlier period, the EBITDA pre margin increased to 25.5% (January-June 2013: 23.8%).
Development of business free cash flow
In the second quarter of 2014, the Merck Millipore division generated business free cash flow of € 125 million (Q2 2013: € 157 million). The decline of around € –31 million was mainly attributable to the increase in trade accounts receivable and in inventories in the second quarter of 2014. Higher capital spending also led to a higher cash outflow than in the year-earlier quarter. The rise in EBITDA pre one-time items could not compensate for these effects.
| XLS |
|
Merck Millipore | Business free cash flow |
||||||
|
|
|
|
|
|
|
|
|
|
|
|
|
|
|
|
|
€ million |
Q2 – 2014 |
Q2 – 2013 |
Change in % |
Jan.–June 2014 |
Jan.–June 2013 |
Change in % |
|
EBITDA pre one-time items |
165.7 |
155.9 |
6.3 |
335.4 |
317.8 |
5.5 |
|
Investments in property, plant and equipment, software as well as advance payments for intangible assets |
–27.7 |
–18.3 |
51.4 |
–47.5 |
–28.9 |
64.5 |
|
Changes in inventories |
–11.3 |
3.1 |
– |
–38.9 |
–12.7 |
– |
|
Changes in trade accounts receivable |
–1.2 |
15.9 |
–107.5 |
–69.1 |
–38.5 |
79.4 |
|
Business free cash flow |
125.5 |
156.6 |
–19.9 |
179.9 |
237.7 |
–24.3 |
In the first half of 2014, the division’s business free cash flow declined by –24.3%, or € –58 million, to € 180 million (January-June 2013: € 238 million).
 back
back
