

| XLS |
|
Consumer Health | Key figures |
||||||||
|
|
|
|
|
|
|
|
||
|
|
|
|
|
|
|
|
||
|
€ million |
Q3 – 2014 |
Q3 – 20131 |
Change |
Jan.–Sept. 2014 |
Jan.–Sept. 20131 |
Change |
||
|
||||||||
|
Total revenues |
205.0 |
201.7 |
1.6 |
570.6 |
563.6 |
1.2 |
||
|
Sales |
204.1 |
201.2 |
1.5 |
569.1 |
561.8 |
1.3 |
||
|
Operating result (EBIT) |
42.1 |
55.1 |
–23.7 |
115.7 |
126.1 |
–8.2 |
||
|
Margin (% of sales) |
20.6 |
27.4 |
|
20.3 |
22.4 |
|
||
|
EBITDA |
44.6 |
57.1 |
–21.9 |
123.0 |
133.0 |
–7.5 |
||
|
Margin (% of sales) |
21.8 |
28.4 |
|
21.6 |
23.7 |
|
||
|
EBITDA pre one-time items |
48.6 |
58.2 |
–16.5 |
131.2 |
132.9 |
–1.3 |
||
|
Margin (% of sales) |
23.8 |
28.9 |
|
23.1 |
23.7 |
|
||
|
Business free cash flow |
13.2 |
36.9 |
–64.1 |
65.6 |
108.7 |
–39.6 |
||
Development of sales and results of operations
In the third quarter of 2014, sales of the Consumer Health division increased in comparison with a relatively strong year-earlier quarter by 1.5% to € 204 million (Q3 2013: € 201 million). Organic sales growth of 1.4% was mainly achieved with the strategic brands Neurobion®, Femibion® and Seven Seas as well as with local brands in Germany. Positive and negative exchange rate effects largely offset each other in the third quarter of 2014.
Consumer Health | Sales by region – Q3 2014
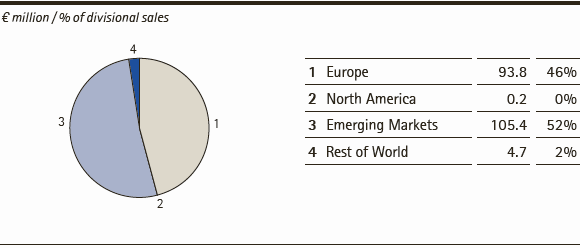
From a geographic perspective, the division’s key regions, namely Europe and Emerging Markets, delivered slight organic growth rates. The Emerging Markets region, which accounts for 52% of sales (Q3 2013: 51%) and is thus the division’s largest region, generated organic sales growth of 4.0%. Including slightly negative exchange rate effects of –0.6%, sales in this region amounted to € 105 million (Q3 2013: € 102 million). The strategic brands Neurobion® and Seven Seas® were the main sales growth drivers. For instance in Brazil, the focus on consumer-oriented marketing activities had a positive effect on sales of Neurobion® and Floratil®.
In Europe, the Consumer Health division saw sales growth of 0.8% supported by positive foreign exchange effects of 1.0%, which led to an increase in sales to € 94 million (Q3 2013: € 93 million). Strong sales volumes of the pregnancy vitamin Femibion®, local brands in Germany as well as Apaisyl®, a local French brand of insect repellent and skin care products, compensated for weaker demand for Nasivin® and Kytta®. The share of divisional sales accounted for by Europe remained constant at 46%.
| XLS |
|
Consumer Health | Sales components by region – Q3 2014 |
|||||
|
|
|
|
|
|
|
|
|
|
|
|
|
|
|
€ million / change in % |
Sales |
Organic growth |
Exchange |
Acquisitions/ |
Total change |
|
Europe |
93.8 |
–0.2 |
1.0 |
– |
0.8 |
|
North America |
0.2 |
–67.5 |
2.4 |
– |
–65.0 |
|
Emerging Markets |
105.4 |
4.0 |
–0.6 |
– |
3.4 |
|
Rest of World |
4.7 |
–12.5 |
–3.1 |
– |
–15.6 |
|
Consumer Health |
204.1 |
1.4 |
0.1 |
– |
1.5 |
In the first nine months of 2014, the Consumer Health division increased its sales slightly by 1.3% to € 569 million (Jan.–Sept. 2013: € 562 million). This was attributable to organic sales growth of 5.0% along with a negative foreign exchange impact of –3.7%. The division’s two most important regions, Emerging Markets and Europe, both delivered organic sales increases; the growth rates were 7.7% and 3.4% respectively. In particular, demand for the products sold under the strategic brands Femibion® and Neurobion® significantly supported organic sales growth in both regions. In addition, organic increases in sales of local brands compensated in Europe for weaker demand for Nasivin® and Bion®.
The results of operations of the Consumer Health division developed as follows:
| XLS |
|
Consumer Health | Results of operations |
||||||||||
|
|
|
|
|
|
|
|
||||
|
|
|
|
|
|
|
|
||||
|
€ million |
Q3 – 2014 |
Q3 – 20131 |
Change |
Jan.–Sept. 2014 |
Jan.–Sept. 20131 |
Change |
||||
|
||||||||||
|
Sales |
204.1 |
201.2 |
1.5 |
569.1 |
561.8 |
1.3 |
||||
|
Royalty, license and |
0.9 |
0.5 |
73.4 |
1.5 |
1.8 |
–18.4 |
||||
|
Total revenues |
205.0 |
201.7 |
1.6 |
570.6 |
563.6 |
1.2 |
||||
|
|
|
|
|
|
|
|
||||
|
Cost of sales2 |
–63.2 |
–60.6 |
4.2 |
–182.5 |
–179.9 |
1.4 |
||||
|
(of which: amortization |
(–) |
(–) |
(–) |
(–) |
(–) |
(–) |
||||
|
Gross profit2 |
141.8 |
141.1 |
0.5 |
388.1 |
383.7 |
1.2 |
||||
|
|
|
|
|
|
|
|
||||
|
Marketing and selling expenses2 |
–77.4 |
–72.1 |
7.3 |
–216.8 |
–214.7 |
1.0 |
||||
|
(of which: amortization |
(–0.7) |
(–0.6) |
(19.0) |
(–2.0) |
(–1.7) |
(17.3) |
||||
|
Royalty, license and |
–1.7 |
–0.6 |
– |
–2.5 |
–1.7 |
50.7 |
||||
|
Administration expenses |
–7.1 |
–6.0 |
19.5 |
–20.0 |
–18.1 |
10.3 |
||||
|
Other operating expenses and income |
–8.4 |
–1.7 |
– |
–18.3 |
–5.9 |
– |
||||
|
Research and development costs |
–5.1 |
–5.7 |
–9.2 |
–14.8 |
–17.3 |
–14.2 |
||||
|
Operating result (EBIT) |
42.1 |
55.1 |
–23.7 |
115.7 |
126.1 |
–8.2 |
||||
|
Depreciation / Amortization / |
2.5 |
1.9 |
28.0 |
7.3 |
6.9 |
4.9 |
||||
|
(of which: one-time items) |
(–) |
(–) |
(–) |
(–) |
(–) |
(–) |
||||
|
EBITDA |
44.6 |
57.1 |
–21.9 |
123.0 |
133.0 |
–7.5 |
||||
|
Restructuring costs |
4.0 |
1.0 |
– |
8.2 |
–0.2 |
– |
||||
|
Integration costs / IT costs |
– |
– |
– |
– |
– |
– |
||||
|
Gains / losses on the divestment |
– |
– |
– |
– |
– |
– |
||||
|
Acquisition costs |
– |
– |
– |
– |
– |
– |
||||
|
Other one-time items |
– |
0.1 |
– |
– |
0.1 |
– |
||||
|
EBITDA pre one-time items |
48.6 |
58.2 |
–16.5 |
131.2 |
132.9 |
–1.3 |
||||
In the third quarter of 2014, the division’s gross profit rose slightly by 0.5% to € 142 million. Therefore, at 69.5%, the gross margin roughly reached the year-earlier quarter (Q3 2013: 70.1%). Higher marketing and selling expenses were mainly related to the implementation of the division’s consumer-oriented marketing concept to strengthen the strategic brands. The change in other operating expenses (net) to € –8 million (Q3 2013: € –2 million) was mainly attributable to one-time items for restructuring measures. Adjusted for amortization and one-time items, the Consumer Health division reported EBITDA pre one-time items of € 49 million (Q3 2013: € 58 million), exceeding the profitability level attained in the first two quarters of 2014. The EBITDA margin pre one-time items was 23.8% (Q3 2013: 28.9%)
In the first nine months of 2014, the division generated EBITDA pre one-time items of € 131 million, which fell just short of the year-earlier period. The resulting EBITDA pre margin slipped to 23.1% (Jan.–Sept. 2013: 23.7%).
Development of business free cash flow
In the third quarter of 2014, business free cash flow of the Consumer Health division decreased by € –24 million to € 13 million. This development was mainly the result of the decline in EBITDA pre one-time items as well as the stronger increase in trade accounts receivable and inventories in the third quarter of 2014 in comparison with the year-earlier quarter.
| XLS |
|
Consumer Health | Business free cash flow |
||||||||
|
|
|
|
|
|
|
|
||
|
|
|
|
|
|
|
|
||
|
€ million |
Q3 – 2014 |
Q3 – 20131 |
Change |
Jan.–Sept. 2014 |
Jan.–Sept. 20131 |
Change |
||
|
||||||||
|
EBITDA pre one-time items |
48.6 |
58.2 |
–16.5 |
131.2 |
132.9 |
–1.3 |
||
|
Investments in property, plant and equipment, software as well as advance payments for intangible assets |
–2.0 |
–0.7 |
162.3 |
–5.1 |
–2.2 |
131.8 |
||
|
Changes in inventories |
–7.8 |
–2.4 |
– |
–14.6 |
–2.4 |
– |
||
|
Changes in trade accounts receivable |
–25.5 |
–18.1 |
41.1 |
–45.9 |
–19.7 |
133.4 |
||
|
Business free cash flow |
13.2 |
36.9 |
–64.1 |
65.6 |
108.7 |
–39.6 |
||
In the first nine months of 2014, business free cash flow declined by –39.6% or € –43 million to € 66 million (Jan.–Sept. 2013: € 109 million).
 search hit 06
