

Overview – Q3 2014
- Higher sales thanks to solid organic growth and sales contribution from the acquisition of AZ Electronic Materials
- Noticeably lower impact from foreign exchange effects
- Emerging Markets remain strongest growth driver
- EBITDA pre one-time items up 3.1%
- Net financial debt in the third quarter lowered thanks to solid cash flow development
- Earnings per share pre one-time items at year-earlier level of € 1.15
| XLS |
|
Merck Group | Key figures |
||||||||
|
|
|
|
|
|
|
|
||
|
|
|
|
|
|
|
|
||
|
€ million |
Q3 – 2014 |
Q3 – 2013 |
Change |
Jan.–Sept. 2014 |
Jan.–Sept. 2013 |
Change |
||
|
||||||||
|
Total revenues |
2,936.4 |
2,751.8 |
6.7 |
8,464.4 |
8,353.4 |
1.3 |
||
|
Sales |
2,905.6 |
2,659.5 |
9.3 |
8,315.0 |
8,063.8 |
3.1 |
||
|
Operating result (EBIT) |
428.9 |
481.8 |
–11.0 |
1,338.2 |
1,346.6 |
–0.6 |
||
|
Margin (% of sales) |
14.8 |
18.1 |
|
16.1 |
16.7 |
|
||
|
EBITDA |
781.5 |
796.4 |
–1.9 |
2,318.7 |
2,343.4 |
–1.1 |
||
|
Margin (% of sales) |
26.9 |
29.9 |
|
27.9 |
29.1 |
|
||
|
EBITDA pre one-time items |
856.6 |
830.7 |
3.1 |
2,509.4 |
2,458.1 |
2.1 |
||
|
Margin (% of sales) |
29.5 |
31.2 |
|
30.2 |
30.5 |
|
||
|
Earnings per share (€)1 |
0.57 |
0.78 |
–26.9 |
2.02 |
2.12 |
–4.7 |
||
|
Earnings per share |
1.15 |
1.15 |
– |
3.46 |
3.33 |
3.9 |
||
|
Business free cash flow |
614.1 |
852.9 |
–28.0 |
1,930.4 |
2,229.5 |
–13.4 |
||
Development of sales and results of operations
In the third quarter of 2014, the Merck Group generated organic sales growth of 4.6%. Acquisitions/divestments (net) increased sales by 5.1% or € 136 million. The first-time consolidation of AZ Electronic Materials in the Performance Materials division as of May 2, 2014 made a positive contribution of € 142 million to Group sales (see also “Acquisition of AZ Electronic Materials S.A.” in the Notes to the Consolidated Financial Statements). Owing to the divestment of the Merck Millipore division’s Discovery and Development Solutions business field, which became effective on March 31, 2014, sales declined in comparison with the year-earlier quarter by € 6 million (see also “Divestment of the Discovery and Development Solutions business field” in the Notes to the Consolidated Financial Statements). The weakening of the euro in the third quarter led to insignificant foreign exchange effects of –0.5%. Overall, sales thus increased sharply by € 246 million or 9.3% to € 2,906 million in the third quarter of 2014 (Q3 2013: € 2,659 million).
| XLS |
|
Merck Group | Sales components by division – Q3 2014 |
|||||
|
|
|
|
|
|
|
|
|
|
|
|
|
|
|
€ million / change in % |
Sales |
Organic growth |
Exchange |
Acquisitions/ |
Total change |
|
Merck Serono |
1,464.6 |
4.5 |
–0.8 |
– |
3.7 |
|
Consumer Health |
204.1 |
1.4 |
0.1 |
– |
1.5 |
|
Performance Materials |
576.1 |
7.0 |
–0.2 |
35.0 |
41.7 |
|
Merck Millipore |
660.8 |
4.5 |
–0.1 |
–1.0 |
3.4 |
|
Merck Group |
2,905.6 |
4.6 |
–0.5 |
5.1 |
9.3 |
All four divisions of the Merck Group posted organic sales growth in the third quarter of 2014. Achieving an absolute increase of € 63 million, which corresponded to an organic growth rate of 4.5%, Merck Serono made the largest absolute contribution to organic sales growth, followed by Merck Millipore with organic sales growth of € 29 million, equivalent to a growth rate of 4.5%, and Performance Materials with € 28 million, or 7.0%. The Consumer Health division delivered an organic sales growth rate of 1.4%, corresponding to an absolute organic sales increase of € 3 million.
Merck Group | Sales by region – Q3 2014
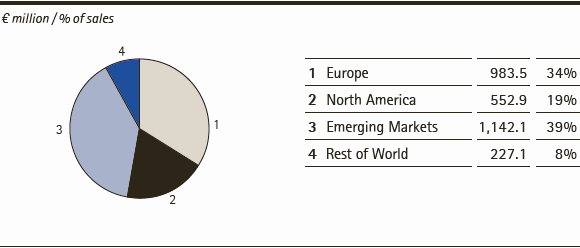
From a regional perspective, the dynamic business performance in the Emerging Markets region, which encompasses Latin America and Asia excluding Japan, again drove the organic growth of the Merck Group in the third quarter. At 9.1%, which corresponded to an absolute organic sales increase of € 88 million, the region delivered strong organic growth, which was primarily fueled by the Merck Serono and Performance Materials divisions. Including currency headwinds of –1.1% and acquisition-related effects of 9.6%, Merck generated sales of € 1,142 million in the Emerging Markets region (Q3 2013: € 971 million). The share of Group sales accounted for by the Emerging Markets region thus increased by two percentage points to 39% (Q3 2013: 37%), maintaining the trend established in past quarters.
In Europe, organic sales increases of 1.4%, acquisition-related growth of 0.9% as well as positive foreign exchange effects of 0.2% lifted sales overall by 2.5% to € 983 million (Q3 2013: € 959 million). Europe’s contribution to Group sales thus fell to 34% (Q3 2013: 36%).
Sales in North America amounted to € 553 million (Q3 2013: € 525 million), which represents a year-on-year increase of 5.2%. Posting organic sales growth of 1.5%, positive exchange rate effects of 0.8% and acquisition-related sales increases of 2.9%, the contribution to Group sales by the North America region was 19% (Q3 2013: 20%).
The Rest of World region, i.e. Japan, Africa and Australia/Oceania, generated € 227 million (Q3 2013: € 204 million) or 8% of Group sales (Q3 2013: 8%). Higher sales were driven both by organic growth (6.7%) as well as acquisition-related increases (9.1%). Including a foreign exchange impact of –4.3%, which primarily stemmed from the Japanese yen, sales in this region rose overall by 11.6%.
| XLS |
|
Merck Group | Sales components by region – Q3 2014 |
|||||
|
|
|
|
|
|
|
|
|
|
|
|
|
|
|
€ million / change in % |
Sales |
Organic growth |
Exchange |
Acquisitions/ |
Total change |
|
Europe |
983.5 |
1.4 |
0.2 |
0.9 |
2.5 |
|
North America |
552.9 |
1.5 |
0.8 |
2.9 |
5.2 |
|
Emerging Markets |
1,142.1 |
9.1 |
–1.1 |
9.6 |
17.6 |
|
Rest of World |
227.1 |
6.7 |
–4.3 |
9.1 |
11.6 |
|
Merck Group |
2,905.6 |
4.6 |
–0.5 |
5.1 |
9.3 |
In the first nine months of 2014, sales of the Merck Group increased by 3.1% to € 8,315 million (Jan.–Sept. 2013: € 8,064 million). Of this amount, 3.9% was attributable to organic growth and 2.7% to the net amount from acquisitions/divestments. Exchange rate changes resulting particularly from the developments of the U.S. dollar, the Japanese yen and Latin American currencies were responsible for a –3.5% decline in sales in the first nine months of 2014. All four divisions generated organic sales growth in the first nine months of 2014. Owing to the first-time consolidation of AZ, the Performance Materials division delivered the highest absolute sales increase of all divisions, generating sales of € 1,484 million in the first nine months of 2014 (Jan.–Sept. 2013: € 1,259 million). Regionally, the strongest organic sales growth was achieved in the Emerging Markets and Rest of World regions, with growth rates of 8.6% and 4.9% respectively. In Europe and North America, the organic sales increases amounted to 1.2% and 0.2% respectively.
The consolidated income statement of the Merck Group is as follows:
| XLS |
|
Merck Group | Consolidated Income Statement |
||||||||
|
|
|
|
|
|
|
|
||
|
|
|
|
|
|
|
|
||
|
€ million |
Q3 – 2014 |
Q3 – 2013 |
Change |
Jan.–Sept. 2014 |
Jan.–Sept. 2013 |
Change |
||
|
||||||||
|
Sales |
2,905.6 |
2,659.5 |
9.3 |
8,315.0 |
8,063.8 |
3.1 |
||
|
Royalty, license and |
30.8 |
92.3 |
–66.6 |
149.4 |
289.6 |
–48.4 |
||
|
Total revenues |
2,936.4 |
2,751.8 |
6.7 |
8,464.4 |
8,353.4 |
1.3 |
||
|
|
|
|
|
|
|
|
||
|
Cost of sales1 |
–948.2 |
–735.5 |
28.9 |
–2,538.2 |
–2,252.0 |
12.7 |
||
|
(of which: amortization |
(–30.0) |
(–12.1) |
(148.1) |
(–54.9) |
(–36.7) |
(49.7) |
||
|
Gross profit1 |
1,988.2 |
2,016.3 |
–1.4 |
5,926.1 |
6,101.3 |
–2.9 |
||
|
|
|
|
|
|
|
|
||
|
Marketing and selling expenses1 |
–760.7 |
–745.7 |
2.0 |
–2,280.4 |
–2,324.6 |
–1.9 |
||
|
(of which: amortization |
(–176.2) |
(–185.6) |
(–5.1) |
(–544.8) |
(–580.0) |
(–6.1) |
||
|
Royalty, license and |
–134.4 |
–144.4 |
–6.9 |
–409.9 |
–437.2 |
–6.3 |
||
|
Administration expenses |
–156.0 |
–136.7 |
14.1 |
–439.3 |
–407.0 |
7.9 |
||
|
Other operating expenses and income |
–4.4 |
–128.4 |
–96.6 |
–181.6 |
–426.9 |
–57.5 |
||
|
Research and development costs |
–503.8 |
–379.3 |
32.8 |
–1,276.8 |
–1,159.1 |
10.2 |
||
|
Operating result (EBIT) |
428.9 |
481.8 |
–11.0 |
1,338.2 |
1,346.6 |
–0.6 |
||
|
|
|
|
|
|
|
|
||
|
Financial result |
–57.2 |
–51.9 |
10.4 |
–142.2 |
–159.1 |
–10.6 |
||
|
Profit before income tax |
371.7 |
430.0 |
–13.6 |
1,196.0 |
1,187.5 |
0.7 |
||
|
|
|
|
|
|
|
|
||
|
Income tax |
–122.1 |
–87.4 |
39.7 |
–313.1 |
–259.9 |
20.5 |
||
|
Profit after tax |
249.6 |
342.5 |
–27.1 |
883.0 |
927.6 |
–4.8 |
||
|
|
|
|
|
|
|
|
||
|
Non-controlling interests |
–0.8 |
–3.0 |
–73.1 |
–5.7 |
–6.0 |
–5.6 |
||
|
Net income |
248.8 |
339.6 |
–26.7 |
877.3 |
921.6 |
–4.8 |
||
Royalty, license and commission income fell by –66.6% to € 31 million in the third quarter of 2014 (Q3 2013: € 92 million). This sharp drop of € –61 million was mainly due to the decrease in royalty, license and commission income in the Merck Serono division. Total revenues (sales plus royalty, license and commission income) rose by 6.7% to € 2,936 million (Q3 2013: € 2,752 million).
Including cost of sales, which increased by 28.9% to € 948 million in the third quarter of 2014 (Q3 2013: € 735 million), the Merck Group recorded gross profit of € 1,988 million (Q3 2013: € 2,016 million). The strong increase in cost of sales was due to the solid organic growth of all divisions as well as the first-time consolidation of AZ, among other things. As part of the purchase price allocation, the acquired inventories of AZ were stepped up to fair values on the date of first-time consolidation. In the third quarter of 2014, € 15 million of this step-up was included as an expense in cost of sales. In addition, cost of sales of the Performance Materials division rose due to the amortization of intangible assets in connection with the AZ purchase price allocation. Along with stronger sales growth in regions with lower margins as well as production and supply bottlenecks for some products in the Merck Serono division, gross margin, i.e. gross profit as a percentage of sales, declined to 68.4% (Q3 2013: 75.8%) in the third quarter of 2013. In addition to the aforementioned effects, the sharp drop in royalty, license and commission income had a negative impact on gross margin.
The improvement in other operating expenses and income (net) to € –4 million (Q3 2013: € –128 million) in the third quarter of 2014 mainly reflected the adjustment of provisions for litigation (see also “Verbal agreement on the resolution of the legal disputes with IBEP” in the Notes to the Consolidated Financial Statements), and the decline in allowances for receivables. By contrast, other operating expenses grew due to higher one-time expenses and impairments of intangible assets in connection with the discontinuation of the clinical development program for tecemotide, (see also “Discontinuation of the clinical development programs for tecemotide and plovamer acetate” in the Notes to the Consolidated Financial Statements).
The increase in research and development costs was mainly attributable to Merck Serono and included in particular expenses for provisions set up for unavoidable subsequent costs that are likely to be incurred in connection with the discontinuation of clinical development programs (tecetomide and plovamer acetate). Consequently, the division accounted for 81.3% (Q3 2013: 77.9%) of Group-wide research and development spending. The Group research spending ratio (research and development costs as a percentage of sales) rose accordingly to 17.3% (Q3 2013: 14.3%).
Owing to the good performance of the Merck share price compared to the DAX, expenses from additions to provisions within the scope of the Merck Long-Term Incentive Plan (LTIP) were higher in the third quarter of 2014 than in the year-earlier quarter. The intrinsic value of Merck Share Units (MSUs) was recognized under the respective functional costs in the income statement depending on the field of activity of the eligible participants. MSUs are virtual Merck shares that eligible executives and employees could receive at the end of a three-year performance period within the scope of the LTIP.
As a result of the development of income and expenses described above, the operating result (EBIT) of the Merck Group declined to € 429 million in the third quarter of 2014.
Merck’s negative financial result grew by a further €–5 million to € –57 million in the third quarter of 2014. This was due in particular to a negative measurement effect from taking into account the time value of Merck Share Units (MSUs), which could not be compensated for by the improvement in net interest.
Income tax expenses of € 122 million (Q3 2013: € 87 million) led to a tax ratio of 32.9% (Q3 2013: 20.3%). The sharp increase in the tax ratio was mainly related to currency hedging of the expected purchase price for the announced acquisition of the Sigma-Aldrich Corporation (see also “Planned Acquisition of Sigma-Aldrich Corporation” in the Notes to the Consolidated Financial Statements).
Net income, i.e. profit after tax attributable to Merck shareholders, was € 249 million in the third quarter of 2014 (Q3 2013: € 340 million). Taking the share split into account, this resulted in earnings per share of € 0.57 (Q3 2013: € 0.78).
| XLS |
|
Merck Group | Reconciliation of EBIT to EBITDA pre one-time items |
||||||
|
|
|
|
|
|
|
|
|
|
|
|
|
|
|
|
|
€ million |
Q3 – 2014 |
Q3 – 2013 |
Change |
Jan.–Sept. 2014 |
Jan.–Sept. 2013 |
Change |
|
Operating result (EBIT) |
428.9 |
481.8 |
–11.0 |
1,338.2 |
1,346.6 |
–0.6 |
|
Depreciation / Amortization / |
352.6 |
314.6 |
12.1 |
980.5 |
996.8 |
–1.6 |
|
(of which: one-time items) |
(3.8) |
(14.7) |
(–73.9) |
(7.7) |
(45.9) |
(–83.3) |
|
EBITDA |
781.5 |
796.4 |
–1.9 |
2,318.7 |
2,343.4 |
–1.1 |
|
Restructuring costs |
24.2 |
32.9 |
–26.3 |
59.8 |
79.5 |
–24.9 |
|
Integration costs / IT costs |
23.8 |
10.5 |
125.3 |
58.4 |
28.0 |
108.7 |
|
Gains/losses on the divestment |
1.1 |
–5.1 |
– |
–5.3 |
13.3 |
– |
|
Acquisition costs |
21.1 |
– |
– |
67.7 |
– |
– |
|
Other one-time items |
5.0 |
–4.1 |
– |
10.0 |
–6.1 |
– |
|
EBITDA pre one-time items |
856.6 |
830.7 |
3.1 |
2,509.4 |
2,458.1 |
2.1 |
After adjusting for depreciation, amortization and one-time expenses, EBITDA pre one-time items, the key financial indicator used to steer operating business, rose slightly to € 857 million (Q3 2013: € 831 million), resulting in an EBITDA margin pre one-time items relative to sales of 29.5% (Q3 2013: 31.2%). Taking into account the share split, earnings per share pre one-time items (earnings per share adjusted by net of tax effect of one-time items and amortization of purchased intangible assets) amounted to € 1.15 in the third quarter of 2014 (Q3 2013: € 1.15).
In the first nine months of 2014, the Merck Group recorded EBITDA pre one-time items of € 2,509 million (Jan.–Sept. 2013: € 2,458 million), thus even slightly exceeding the good year-earlier result. At 30.2%, the EBITDA margin pre one-time items nearly reached the high year-earlier level (Jan.–Sept. 2013: 30.5%). Earnings per share pre one-time items for the first nine months of 2014 rose by 3.9% to € 3.46 (Jan.–Sept. 2013: € 3.33).
Net assets and financial position
| XLS |
|
Merck Group | Balance sheet structure |
||||||
|
|
|
|
|
|
|
|
|
|
|
|
|
|
|
|
|
|
September 30, 2014 |
December 31, 2013 |
Change |
|||
|
|
€ million |
in % |
€ million |
in % |
€ million |
in % |
|
Current assets |
7,313.6 |
32.2 |
7,384.5 |
35.5 |
–70.9 |
–1.0 |
|
of which: |
|
|
|
|
|
|
|
Cash and cash equivalents |
1,338.3 |
|
980.8 |
|
357.5 |
|
|
Current financial assets |
1,316.6 |
|
2,410.5 |
|
–1,093.9 |
|
|
Trade accounts receivable |
2,268.1 |
|
2,021.4 |
|
246.8 |
|
|
Inventories |
1,656.0 |
|
1,474.2 |
|
181.7 |
|
|
Other current assets |
734.6 |
|
497.6 |
|
237.0 |
|
|
|
|
|
|
|
|
|
|
Non-current assets |
15,407.9 |
67.8 |
13,434.1 |
64.5 |
1,973.9 |
14.7 |
|
of which: |
|
|
|
|
|
|
|
Intangible assets |
11,531.0 |
|
9,867.2 |
|
1,663.9 |
|
|
Property, plant and equipment |
2,861.6 |
|
2,647.2 |
|
214.5 |
|
|
Other non-current assets |
1,015.3 |
|
919.7 |
|
95.6 |
|
|
|
|
|
|
|
|
|
|
Total assets |
22,721.5 |
100.0 |
20,818.6 |
100.0 |
1,902.9 |
9.1 |
|
|
|
|
|
|
|
|
|
Current liabilities |
5,827.5 |
25.6 |
3,898.8 |
18.7 |
1,928.7 |
49.5 |
|
of which: |
|
|
|
|
|
|
|
Current financial liabilities |
2,015.2 |
|
440.4 |
|
1,574.7 |
|
|
Trade accounts payable |
1,370.3 |
|
1,364.1 |
|
6.2 |
|
|
Current provisions |
939.8 |
|
494.7 |
|
445.2 |
|
|
Other current liabilities |
1,502.2 |
|
1,599.6 |
|
–97.4 |
|
|
|
|
|
|
|
|
|
|
Long-term liabilities |
5,108.9 |
22.5 |
5,850.6 |
28.1 |
–741.7 |
–12.7 |
|
of which: |
|
|
|
|
|
|
|
Non-current financial liabilities |
2,161.2 |
|
3,257.5 |
|
–1,096.3 |
|
|
Non-current provisions |
581.1 |
|
1,011.1 |
|
–429.9 |
|
|
Provisions for pensions and other post-employment benefits |
1,377.5 |
|
910.9 |
|
466.6 |
|
|
Other non-current liabilities |
989.1 |
|
671.1 |
|
318.0 |
|
|
|
|
|
|
|
|
|
|
Equity |
11,785.2 |
51.9 |
11,069.2 |
53.2 |
716.0 |
6.5 |
|
|
|
|
|
|
|
|
|
Total liabilities and equity |
22,721.5 |
100.0 |
20,818.6 |
100.0 |
1,902.9 |
9.1 |
The total assets of the Merck Group amounted to € 22,722 million as of Sept. 30, 2014. This represents an increase of 9.1% over Dec. 31, 2013 (€ 20,819 million). The change in the balance sheet structure was also due to the first-time consolidation of AZ Electronic Materials S.A. as of May 2, 2014. The payment of the purchase price totaling € 1,875 million was made fully in cash. As part of the purchase price allocation for the AZ acquisition, the acquired assets and liabilities were measured at fair values in the balance sheet. On the date of first-time consolidation, this led to an increase in intangible assets (excluding goodwill) by € 1,057 million. The goodwill from the transaction amounted to € 880 million. More information about the purchase price allocation for the AZ acquisition can be found under “Acquisition of AZ Electronic Materials S.A.” in the Notes to the Consolidated Financial Statements. The increase in working capital of the Merck Group to € 2,554 million (Dec. 31, 2013: € 2,132 million) resulted largely from the first-time consolidation of AZ as well as positive foreign exchange effects. Overall, around one-third of the increase in total assets was due to currency translation changes caused by the weaker euro. The change in non-current and current financial liabilities was primarily related to the maturity in March 2015 of a bond issued by Merck Financial Services with a nominal volume of € 1,350 million. Owing to the payment of the purchase price for AZ in the second quarter of 2014, net financial debt had increased to € 2,220 million as of June 30, 2014. As of September 30, 2014, this figure had already declined to € 1,521 million (Dec. 31, 2013: € 307 million). The increase in pension provisions resulted largely from the required reduction in the discount rate when calculating the present value of the defined benefit obligations. The resulting actuarial losses were disclosed in the Consolidated Statement of Comprehensive Income. At 51.9% (Dec. 31, 2013: 53.2%), the equity ratio remained at a high level.
Business free cash flow of the Merck Group was € 614 million in the third quarter of 2014 (Q3 2013: € 853 million), decreasing by € –239 million or –28.0%. This decline was primarily due to the development of trade accounts receivable. Whereas receivables were lowered by € –144 million in the year-earlier quarter, this balance sheet item increased by € 49 million in the third quarter of 2014. In addition, higher investments in property, plant and equipment in the third quarter of 2014 led to an increase in cash outflows.
| XLS |
|
Merck Group | Business free cash flow |
||||||
|
|
|
|
|
|
|
|
|
|
|
|
|
|
|
|
|
€ million |
Q3 – 2014 |
Q3 – 2013 |
Change |
Jan.–Sept. 2014 |
Jan.–Sept. 2013 |
Change |
|
EBITDA pre one-time items |
856.6 |
830.7 |
3.1 |
2,509.4 |
2,458.1 |
2.1 |
|
Investments in property, plant and equipment, software as well as advance payments for intangible assets |
–136.3 |
–88.8 |
53.5 |
–295.1 |
–258.7 |
14.1 |
|
Changes in inventories |
–37.1 |
–32.6 |
13.8 |
–181.7 |
–31.7 |
– |
|
Changes in trade accounts receivable |
–49.3 |
143.6 |
– |
–246.8 |
61.7 |
– |
|
Adjustments first-time consolidation of AZ Electronic Materials |
–19.8 |
– |
– |
144.6 |
– |
– |
|
Business free cash flow |
614.1 |
852.9 |
–28.0 |
1,930.4 |
2,229.5 |
–13.4 |
In the first nine months of 2014, the Merck Group generated business free cash flow of € 1,930 million (Jan.–Sept. 2013: € 2,230 million), falling short of the very high year-earlier level.
 back
back
