

In the first half of 2012, total revenues of the Merck Group increased 7.4% to € 5,497 million (H1 2011: € 5,119 million), driven by similar contributions from both organic growth (+3.3%) and positive benefits from changes in foreign exchange rates (+3.5%) and supported by growth from acquisitions (+0.5%). Sales were up 7.3% to € 5,307 million (H1 2011: € 4,947 million). Organic sales growth of 3.2% was helped by a favorable impact of 3.6% from foreign exchange rates and 0.5% in additional sales from acquired businesses. After a moderate start to 2012, business trends strengthened in the second quarter. The strongest driver of organic growth was Merck Serono, which benefited from higher volumes and positive pricing trends in most of its therapeutic areas. From a regional perspective, the share of Group sales in Emerging Markets and North America increased to 34% and 19%, respectively (H1 2011: 33% and 18%, respectively), reflecting softer economic conditions in Europe.
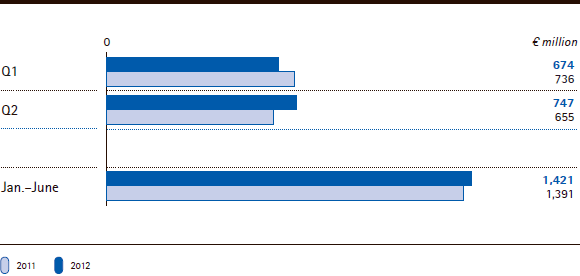
EBITDA pre one-time items was € 1,421 million, or 26.8% of sales, in the first half of 2012 (H1 2011: € 1,391 million, or 28.1% of sales), up 2.2% but down as a percentage of sales, reflecting a tough year-on-year comparison due to an exceptionally strong first quarter 2011 in all divisions. On a reported basis, the first six months of 2012 included one-time items totaling € 424 million, including € 387 million relating to the Group’s "Fit for 2018" efficiency program. Factoring in these higher one-time items as well as a net € 54 million one-time gain in the first six months of 2011 which included the disposal of the CropBioscience business, reported EBITDA declined by 28.8% to € 1,028 million (H1 2011: € 1,445 million). EPS pre one-time items for the current year’s first half amounted to € 3.58 (H1 2011: € 3.50), representing growth of 2.3%.
Merck Group | EBITDA pre one-time items by quarter/half year
Free cash flow totaled € 1,045 million in the first half of 2012 (H1 2011: € 899 million), up 16.3%, and was primarily used for the dividend payment as well as further debt reduction, leading to net financial debt of € 2,942 million by June 30, 2012 (Dec. 31, 2011: € 3,484 million).
During the second quarter, Merck held a Capital Market Day on May 15, 2012 at its headquarters in Darmstadt, Germany, where it provided further details around its efficiency program, which kicked off in February 2012. From a financial perspective, Merck aims to generate net cost savings of € 300 million annually in its Merck Serono division by 2014. Out of these savings, 40% are planned to come from lower but more effective spending in Merck Serono’s Research & Development, while Commercial Operations (impacting SG&A costs*) will contribute 60% of the savings, primarily through a leaner and more centralized organization, including the division’s headquarters.
On June 6, 2012, Merck and Dr. Reddy’s Laboratories Ltd., India, announced that the two companies will collaborate to jointly develop and globally market follow-on biologics, also known as “biosimilars”, with the primary focus on monoclonal antibodies. Biosimilars, which IMS Health expects to represent a strongly growing market of US$ 11 billion to US$ 25 billion by 2020, are highly similar or interchangable alternative products to marketed biological drugs. In contrast to classic generic drugs, which are made from relatively easily duplicated chemical-based active ingredients, biosimilars are much more complex molecular structures and typically differ slightly from the original, requiring much more demanding development and manufacturing approval processes. The strategic rationale of this collaboration is to leverage Dr. Reddy’s strong expertise in biosimilars with Merck’s strength in biologic drug development and production as well as its strong position in emerging markets.
* selling, general and administrative costs, including marketing and selling expenses, royalty, license and commission expenses, administration expenses as well as other operating income and expenses
 back
back
