

In the third quarter of 2013, the Merck Millipore division again achieved strong organic sales growth despite a market environment that remained difficult. The 5.9% increase contrasted with changes in foreign exchange rates, which impacted sales by –7.2%. Last year’s acquisition of Biochrom AG, Berlin, increased sales by 0.7%. Overall sales therefore declined slightly by –0.6% to € 639 million (Q3 2012: € 643 million). Currency headwinds stemmed mainly from the Japanese yen and the U.S. dollar. The royalty income generated by products from the Process Solutions and Bioscience business units remained at the previous year’s level of € 6 million.
As a result of price and volume increases, the division’s two largest business units in terms of sales, Lab Solutions and Process Solutions, were able to more than offset the weaker organic sales development of the third business unit, Bioscience. Consequently, notable organic growth was achieved despite weakness in the North American market. This underlines the division’s balanced product portfolio, which successfully compensated for fluctuations in demand in individual market segments in the third quarter of 2013.
The Process Solutions business unit, which markets products and services for the pharmaceutical production value chain, was an important driver of divisional sales growth in the third quarter of 2013. As a result of higher prices and sales volumes, Process Solutions reported organic sales growth of 7.4%. Including a negative foreign exchange impact, sales amounted to € 267 million (Q3 2012: € 259 million). Therefore, the business unit accounted for 42% of divisional sales (Q3 2012: 40%). The increase was driven by higher demand for products used in biopharmaceutical production, especially in Asian countries within the Emerging Markets region, as well as the very positive development of sales to the pharmaceutical industry in the third quarter of 2013.
The Lab Solutions business unit, where Merck Millipore markets a broad portfolio of products used by researchers and scientific laboratories, also achieved strong organic growth of 7.5%. Taking into account currency headwinds of –8.2%, sales amounted to € 269 million (Q3 2012: € 271 million). Besides price increases, organic growth was mainly driven by elevated demand for biomonitoring products, particularly from customers in the pharmaceutical industry.
The Bioscience business unit, which primarily markets products and services for academic and pharma research laboratories, recorded an organic sales decline of –1.3%. Including adverse foreign exchange effects of –7.1%, sales amounted to € 104 million (Q3 2012: € 113 million). Here, across-the-board health care spending cuts in the United States continued to soften demand.
| XLS |
|
Merck Millipore | Key figures | ||||||
|
|
|
|
|
|
|
|
|
|
|
|
|
|
|
|
|
€ million |
Q3 – 2013 |
Q3 – 2012 |
Change |
Jan.–Sept. |
Jan.–Sept. |
Change |
|
Total revenues |
645.5 |
648.2 |
–0.4% |
1,988.8 |
1,958.9 |
1.5% |
|
Sales |
639.0 |
642.7 |
–0.6% |
1,974.0 |
1,944.7 |
1.5% |
|
Operating result (EBIT) |
66.6 |
68.1 |
–2.2% |
211.3 |
221.2 |
–4.5% |
|
Margin (% of sales) |
10.4% |
10.6% |
|
10.7% |
11.4% |
|
|
EBITDA |
144.7 |
144.5 |
0.1% |
444.4 |
449.2 |
–1.1% |
|
Margin (% of sales) |
22.6% |
22.5% |
|
22.5% |
23.1% |
|
|
EBITDA pre one-time items |
157.2 |
152.0 |
3.4% |
475.0 |
470.9 |
0.9% |
|
Margin (% of sales) |
24.6% |
23.7% |
|
24.1% |
24.2% |
|
In the third quarter of 2013, cost of sales amounted to € 263 million (Q3 2012: € 269 million), which represents a year-on-year decrease of –2.4%. This yielded gross profit of € 383 million (Q3 2012: € 379 million), or 59.9% of sales (Q3 2012: 59.0 %). The increase in gross margin was attributable to price increases as well as higher capacity utilizations.
Marketing and selling expenses rose by 3.1% to € 171 million (Q3 2012: € 166 million). Administration expenses declined in the third quarter of 2013 by –4.2% to € 25 million (Q3 2012: € 26 million), reflecting the positive effects of the “Fit for 2018” efficiency program. The increase in other operating expenses from € 21 million to € 26 million was mainly due to one-time items of € 12 million (Q3 2012: € 7 million).
Merck Millipore’s R&D costs decreased slightly as a result of foreign exchange effects among other things to € 40 million (Q3 2012: € 43 million). In the third quarter of 2013, the ratio of R&D costs to sales was therefore 6.3% (Q3 2012: 6.7%). The Process Solutions business unit accounts for the major part of the R&D budget.
The slight decline in the operating result (EBIT) of –2.2% to € 67 million (Q3 2012: € 68 million) was mainly attributable to higher expenses from one-time items. After taking depreciation and amortization into account, EBITDA remained unchanged compared to the year-earlier quarter at € 145 million. Adjusted for one-time charges, EBITDA pre rose by 3.4% to € 157 million, or 24.6% of sales (Q3 2012: € 152 million; 23.7% of sales). The margin improved despite unfavorable foreign exchange developments and the difficult market situation in North America, reflecting strong organic growth, a resilient product portfolio, and strict cost control.
Merck Millipore | Sales by region – Q3 2013
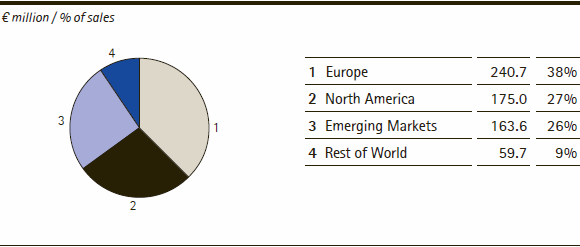
Sales development by region
In the third quarter of 2013, all regions delivered positive organic growth rates and recorded negative foreign exchange effects.
Accounting for 38% of divisional sales (Q3 2012: 36%), Europe, which is the division’s largest geographic market, reported organic growth of 2.7% and sales of € 241 million (Q3 2012: € 233 million). The rise in sales was mainly driven by good demand for products from the Process Solutions and Lab Solutions business units.
North America reported slight organic growth of 1.3%. However, this was more than offset by negative foreign exchange effects of –5.3%, resulting in an overall sales decline of –4.0% to € 175 million (Q3 2012: € 182 million). Organic sales growth of products from the Process Solutions and Lab Solutions business units offset weaker demand for laboratory materials from the Bioscience business unit, which continued to be affected by government budget cuts in the United States.
With organic growth of 17.4% and a foreign exchange impact of –10.8%, the Emerging Markets region generated sales of € 164 million (Q3 2012: € 153 million). This was fueled by good development of demand for products from all the division’s business units. Consequently, this region’s share of divisional sales rose from 24% in the year-earlier quarter to 26% in the third quarter of 2013.
As a result of significant currency headwinds of –23.3%, especially relative to the Japanese yen, sales in the Rest of World region declined to € 60 million (Q3 2012: € 74 million). With slight organic growth of 3.6%, this region’s share of divisional sales declined to 9% (Q3 2012: 12%).
| XLS |
|
Merck Millipore | Growth components by region – Q3 2013 | |||||
|
|
|
|
|
|
|
|
|
|
|
|
|
|
|
€ million / change in % |
Sales |
Organic |
Exchange rate |
Acquisitions/ |
Sales |
|
Europe |
240.7 |
2.7% |
–1.1% |
1.8% |
3.4% |
|
North America |
175.0 |
1.3% |
–5.3% |
– |
–4.0% |
|
Emerging Markets |
163.6 |
17.4% |
–10.8% |
0.1% |
6.7% |
|
Rest of World |
59.7 |
3.6% |
–23.3% |
– |
–19.6% |
|
Merck Millipore |
639.0 |
5.9% |
–7.2% |
0.7% |
–0.6% |
First Nine Months 2013 Performance
In the first nine months of 2013, Merck Millipore’s total revenues increased by 1.5% to € 1,989 million (Jan.-Sept. 2012: € 1,959 million), including € 15 million from royalty income (Jan.-Sept. 2012: € 14 million). Sales increased by 1.5% to € 1,974 million (Jan.-Sept. 2012: € 1,945 million). The good performance of both the Process Solutions and Lab Solutions business units fueled organic growth of 5.0% in the Merck Millipore division, which was largely offset by the foreign exchange impact of –4.1%. Last year’s acquisition of Biochrom AG contributed 0.6% to the reported sales increase.
While EBITDA declined slightly by –1.1% to € 444 million (Jan.-Sept. 2012: € 449 million), the division’s EBITDA pre increased slightly by 0.9% to € 475 million (Jan.-Sept. 2012: € 471 million). Relative to sales, the EBITDA pre margin was 24.1% in the first nine months of 2013 (Jan.-Sept. 2012: 24.2%).
 back
back
