

| XLS |
|
Merck Millipore | Key figures |
||||||
|
|
|
|
|
|
|
|
|
|
|
|
|
|
|
|
|
€ million |
Q3 – 2014 |
Q3 – 2013 |
Change |
Jan.–Sept. 2014 |
Jan.–Sept. 2013 |
Change |
|
Total revenues |
664.4 |
645.5 |
2.9 |
1,986.3 |
1,988.8 |
–0.1 |
|
Sales |
660.8 |
639.0 |
3.4 |
1,976.0 |
1,974.0 |
0.1 |
|
Operating result (EBIT) |
71.7 |
66.6 |
7.7 |
233.9 |
211.3 |
10.7 |
|
Margin (% of sales) |
10.9 |
10.4 |
|
11.8 |
10.7 |
|
|
EBITDA |
149.6 |
144.7 |
3.4 |
463.7 |
444.4 |
4.3 |
|
Margin (% of sales) |
22.6 |
22.6 |
|
23.5 |
22.5 |
|
|
EBITDA pre one-time items |
160.5 |
157.2 |
2.1 |
495.9 |
475.0 |
4.4 |
|
Margin (% of sales) |
24.3 |
24.6 |
|
25.1 |
24.1 |
|
|
Business free cash flow |
108.5 |
139.0 |
–21.9 |
288.4 |
376.8 |
–23.4 |
Development of sales and results of operations
In the third quarter, the Merck Millipore division again posted solid organic sales growth of 4.5%, which was mainly driven by the positive business development of Process Solutions. The organic increase was countered by insignificant negative foreign exchange effects of –0.1% as well as the divestment of the Discovery and Development Solutions business field as of March 31, 2014 (–1.0%). Taking these effects into account, divisional sales increased overall by 3.4% to € 661 million (Q3 2013: € 639 million).
Merck Millipore | Sales by region – Q3 2014
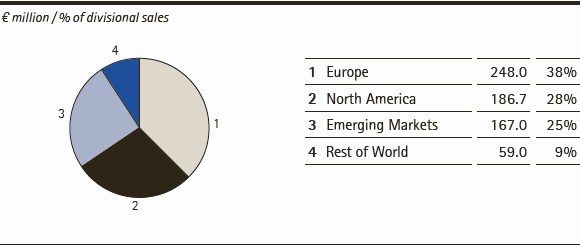
Merck Millipore posted organic sales growth in all regions in the third quarter of 2014. Accounting for an unchanged 38% of divisional sales, Europe remained the division’s largest geographic market, delivering organic growth of 3.2% and sales of € 248 million (Q3 2013: € 241 million). In this region, the strong sales increases achieved by the Process Solutions business area more than offset the slightly weaker business of the two other business areas Lab Solutions and Bioscience in a few countries.
In North America, the division’s business developed positively with good organic sales growth of 8.3%. The stronger U.S. dollar in the third quarter resulted in a slight sales increase of 0.9% due to currency translation. Taking divestment-related sales declines of –2.5% into account, sales in North America rose to € 187 million (Q3 2013: € 175 million), which represented a share of 28% (Q3 2013: 27%) of Merck Millipore’s global sales in the third quarter of 2014.The organic sales growth in North America was mainly attributable to the Process Solutions business area and its products for biopharmaceutical manufacturing.
In the Emerging Markets region, the Merck Millipore division generated organic growth of 2.8% in comparison with a strong year-earlier basis, thus delivering a slight increase in sales to € 167 million (Q3 2013: € 164 million). In particular, Lab Solutions increased its sales in Latin American markets. The share of divisional sales accounted for by the Emerging Markets region correspondingly amounted to 25% (Q3 2013: 26%).
As a result of currency headwinds of –4.3%, which could not be completely compensated for by organic sales increases, sales in the Rest of World region declined slightly to € 59 million (Q3 2013: € 60 million). Therefore, this region’s share of total divisional sales remained at 9% as in the year-ago quarter.
| XLS |
|
Merck Millipore | Sales components by region – Q3 2014 |
|||||
|
|
|
|
|
|
|
|
|
|
|
|
|
|
|
€ million / change in % |
Sales |
Organic growth |
Exchange |
Acquisitions/ |
Total change |
|
Europe |
248.0 |
3.2 |
0.4 |
–0.5 |
3.1 |
|
North America |
186.7 |
8.3 |
0.9 |
–2.5 |
6.7 |
|
Emerging Markets |
167.0 |
2.8 |
–0.5 |
–0.2 |
2.1 |
|
Rest of World |
59.0 |
3.8 |
–4.3 |
–0.6 |
–1.1 |
|
Merck Millipore |
660.8 |
4.5 |
–0.1 |
–1.0 |
3.4 |
In the third quarter of 2014, sales developments varied in the three business areas. The Process Solutions business area, which primarily markets products and services for the pharmaceutical production value chain, generated very strong organic sales growth of 10.5%. This was mainly driven by increasing demand from the biopharmaceutical manufacturing industry for purification and sterilization solutions. Taking divestment-related declines into account, sales amounted to € 295 million (Q3 2013: € 273 million). The share of divisional sales generated by Process Solutions thus rose by two percentage points to 45% (Q3 2013: 43%).
Lab Solutions, which markets a broad range of products for researchers and scientific laboratories and accounted for a 40% share (Q3 2013: 42%) of divisional sales, nearly maintained its sales at the year-earlier level at € 268 million (Q3 2013: € 269 million). Higher sales of Lab Water products were offset by lower sales of laboratory chemicals.
The Bioscience business area, which primarily markets products and services for academic and pharmaceutical research laboratories, posted sales of € 97 million (Q3 2013: € 97 million) amid slightly positive currency translation effects and an organic sales decline of –0.3%. The impact of across-the-board health care spending cuts in the United States as well as lower demand for antibodies in Europe and North America weighed on the business area whereas higher demand from diagnostic laboratories for cell analysis systems (Amnis®, Guava®) had a positive effect. The business area’s share of divisional sales was unchanged at 15% in the third quarter of 2014.
| XLS |
|
Merck Millipore | Sales components by business area – Q3 2014 |
|||||
|
|
|
|
|
|
|
|
|
|
|
|
|
|
|
€ million / change in % |
Sales |
Organic growth |
Exchange |
Acquisitions/ divestments |
Total change |
|
Bioscience |
97.4 |
–0.3 |
0.5 |
– |
0.2 |
|
Lab Solutions |
268.0 |
0.2 |
–0.6 |
– |
–0.4 |
|
Process Solutions |
295.5 |
10.5 |
– |
–2.3 |
8.3 |
In the first nine months of 2014, sales of the Merck Millipore division were virtually unchanged at € 1,976 million (Jan.–Sept. 2013: € 1,974 million). The division delivered organic sales growth of 4.1%. This was driven mainly by the Process Solutions business area, which generated organic growth of 8.4%. While Lab Solutions also contributed to the division’s organic growth (1.2%), the Bioscience business area reported a slight organic sales decline of –0.3%. The divestment of the Discovery and Development Solutions business field impacted sales by –0.6% in the first nine months of 2014.
The results of operations of the Merck Millipore division developed as follows:
| XLS |
|
Merck Millipore | Results of operations |
||||||||
|
|
|
|
|
|
|
|
||
|
|
|
|
|
|
|
|
||
|
€ million |
Q3 – 2014 |
Q3 – 2013 |
Change |
Jan.–Sept. 2014 |
Jan.–Sept. 2013 |
Change |
||
|
||||||||
|
Sales |
660.8 |
639.0 |
3.4 |
1,976.0 |
1,974.0 |
0.1 |
||
|
Royalty, license and |
3.6 |
6.5 |
–44.2 |
10.3 |
14.8 |
–30.1 |
||
|
Total revenues |
664.4 |
645.5 |
2.9 |
1,986.3 |
1,988.8 |
–0.1 |
||
|
|
|
|
|
|
|
|
||
|
Cost of sales1 |
–292.1 |
–274.5 |
6.4 |
–854.6 |
–864.4 |
–1.1 |
||
|
(of which: amortization |
(–11.9) |
(–11.9) |
(0.1) |
(–35.6) |
(–36.2) |
(–1.7) |
||
|
Gross profit1 |
372.3 |
370.9 |
0.4 |
1,131.8 |
1,124.4 |
0.7 |
||
|
|
|
|
|
|
|
|
||
|
Marketing and selling expenses1 |
–205.6 |
–209.2 |
–1.7 |
–613.2 |
–628.9 |
–2.5 |
||
|
(of which: amortization |
(–38.1) |
(–38.0) |
(0.4) |
(–113.0) |
(–114.6) |
(–1.4) |
||
|
Royalty, license and |
–3.9 |
–4.3 |
–9.2 |
–11.4 |
–12.1 |
–6.1 |
||
|
Administration expenses |
–26.3 |
–24.9 |
5.7 |
–80.7 |
–74.6 |
8.1 |
||
|
Other operating expenses and income |
–23.0 |
–25.6 |
–10.1 |
–73.1 |
–76.0 |
–3.8 |
||
|
Research and development costs |
–41.8 |
–40.4 |
3.6 |
–119.5 |
–121.4 |
–1.5 |
||
|
Operating result (EBIT) |
71.7 |
66.6 |
7.7 |
233.9 |
211.3 |
10.7 |
||
|
Depreciation / Amortization / |
77.9 |
78.1 |
–0.2 |
229.8 |
233.1 |
–1.4 |
||
|
(of which: one-time items) |
(–) |
(–) |
(–) |
(–) |
(–) |
(–) |
||
|
EBITDA |
149.6 |
144.7 |
3.4 |
463.7 |
444.4 |
4.3 |
||
|
Restructuring costs |
2.0 |
3.9 |
–48.4 |
7.4 |
12.6 |
–40.8 |
||
|
Integration costs / IT costs |
9.0 |
6.1 |
46.1 |
25.1 |
14.6 |
71.6 |
||
|
Gains / losses on the divestment |
–0.1 |
– |
– |
–0.3 |
– |
– |
||
|
Acquisition costs |
– |
– |
– |
– |
– |
– |
||
|
Other one-time items |
– |
2.4 |
– |
– |
3.4 |
– |
||
|
EBITDA pre one-time items |
160.5 |
157.2 |
2.1 |
495.9 |
475.0 |
4.4 |
||
In the third quarter of 2014, gross profit increased slightly by 0.4% to € 372 million despite lower royalty, license and commission income. Growing volume demand, especially in Process Solutions, led to higher cost of sales and a gross margin of 56.3% (Q3 2013: 58.1%). In comparison with the year-earlier quarter, Merck Millipore increased its operating result (EBIT) by 7.7% to € 72 million. After eliminating depreciation and amortization, and adjusting for one-time items, EBITDA pre one-time items, the most important performance indicator, climbed 2.1% to € 161 million. This resulted in a stable EBITDA pre margin of 24.3% (Q3 2013: 24.6%).
In the first nine months of 2014, EBITDA pre one-time items of the Merck Millipore division rose by € 21 million, or 4.4%, to € 496 million, reflecting the solid development of the operating business as well as cost control in marketing and sales. In comparison with the year-earlier period, the EBITDA pre margin increased to 25.1% (Jan.–Sept. 2013: 24.1%).
Development of business free cash flow
In the third quarter of 2014, the Merck Millipore division generated business free cash flow of € 109 million (Q3 2013: € 139 million). The decline of around € –30 million was primarily attributable to higher capital spending in the reporting period. In addition, the reduction in trade accounts receivable was not as strong as in the year-ago quarter.
| XLS |
|
Merck Millipore | Business free cash flow |
||||||
|
|
|
|
|
|
|
|
|
|
|
|
|
|
|
|
|
€ million |
Q3 – 2014 |
Q3 – 2013 |
Change |
Jan.–Sept. 2014 |
Jan.–Sept. 2013 |
Change |
|
EBITDA pre one-time items |
160.5 |
157.2 |
2.1 |
495.9 |
475.0 |
4.4 |
|
Investments in property, plant and equipment, software as well as advance payments for intangible assets |
–46.0 |
–27.2 |
69.3 |
–93.5 |
–56.0 |
66.8 |
|
Changes in inventories |
–24.5 |
–21.1 |
16.3 |
–63.4 |
–33.8 |
87.8 |
|
Changes in trade accounts receivable |
18.5 |
30.1 |
–38.5 |
–50.6 |
–8.4 |
– |
|
Business free cash flow |
108.5 |
139.0 |
–21.9 |
288.4 |
376.8 |
–23.4 |
In the first nine months of 2014, the division’s business free cash flow declined by –23.4%, or € –88 million, to € 288 million (Jan.–Sept. 2013: € 377 million).
 search hit 04
